
Sunday, October 14, 2018

Saturday, October 13, 2018

Friday, October 12, 2018
White Boards, Let Me Count The Ways.
 I have a set of whiteboards in my class that I use regularly. I love whiteboards because they are an empty surface waiting to be filled with mathematical ideas. They also start conversations between partners as they strive to find the correct answer.
I keep a set on a shelf and I usually have some sort of whiteboard application on the iPads but this year they are late getting the iPads out so I can't use those.
Honestly most of my students would much rather work the problem out on a white board than show their work on paper. In addition, if they make a mistake it is much easier for them to make corrections. I don't know when the desire to write only answers happened but its a habit by the time they arrive in high school. Here are some of the ways students use physical or digital whiteboards in my math class.
1. During jeopardy, they have to write their answers on the whiteboard. I ask them to place their calculations on one half while the answer is on the other half. This way I can do a quick assessment to see where they made a mistake if their answer is wrong. The version of jeopardy I play is that all the students receive points if they have the correct answer.
I've found that if you play it the same way they do on television, many of the struggling students give up in a couple of rounds because they are unable to be the first with the correct answer. In addition, I am able to check every student for understanding of certain concepts. I use a lot of premade games at Jeopardy Labs that makes life easier.
2. In Pre-Algebra, I have students draw tiles on the white boards to answer questions like 5 - 8 to find the answer or I have them illustrate in some way basic math for integers so I can see if they understand what is going on. Yesterday, we did it for simple addition and subtraction of integers and a few had a light bulb go off when they saw that - 8 - 5 gave them 13 negative blocks rather than 3 positive blocks. Up to this point they didn't see the signs.
3. White boards, especially ones with a coordinate plane, are wonderful during both guided and individual practice because I can check work or correct problems more easily. The coordinate planes allow students to practice graphing and I can spot check for problems. The other thing, is I can place a problem on the board and students hold their boards or iPads up so I can check their work. Its quick and easy.
4. When I have them write word problems using two numbers and a term, I like having them create a drawing of the situation for the word problem first before they begin writing the word problem. As they say a "picture is worth a thousand words" and it clarifies their ideas when they sketch the situation.
5. If they have questions, they can write it down, signal and I can go check the board so they don't feel embarrassed to ask. Furthermore, I write the answer down so they have something they can read rather than relying only on their listening skills in a room that sometimes gets a bit noisy.
These are some of the ways I use whiteboards in my classroom to encourage all students to work. Let me know what you think, I'd love to hear. Have a great weekend.
Thursday, October 11, 2018
The Pythagorean Theorem and Sports.
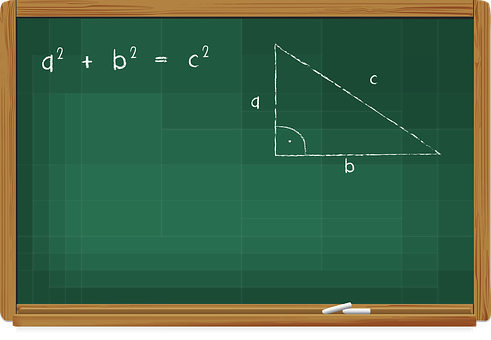 How many times have you taught the Pythagorean Theorem using the standard triangle, drew the squares to show it all works out, or you've had them draw a standard triangle like a 3-4-5 or 12-5-13 on a piece of paper. Next, they've drawn square off the legs, color them before cutting them out and placing them inside the drawn square for the hypotenuse?
Instead of talking about ladders stuck up against a multi story building, lets apply it to football, a topic most males in your classroom can relate to.
The National Science Foundation created a wonderful three to four minute video designed to show people how the Pythagorean Theorem is used to calculate the angle of pursuit taken by a football player who wants to tackle the guy with the ball. Sorry, I don't watch football so I really don't know all the names of the positions.
Picture this is you will. The receiver catches the ball and starts running in as straight a line as he can down the field. The person who needs to tackle him is about 30 fyards to the right. He runs in a diagonal so he can tackle the receiver at around the 40 yard mark. Using the Pythagorean theorem, he'll have to run about 50 yards to intercept the receiver and tackle him. The video is well done and shows students how this works.
This site provides a written explanation of the material on the video. The nice thing about a written explanation, is students have a chance to practice reading for information which meets a reading standard.
In addition, a researcher discovered that this same theorem could be used to predict a teams expected wins based on the number of runs scored and the number of runs they allowed. Think of it this way:
Expected wins = (Number of runs scored)^2/(number of runs scored)^2 +(number of runs allowed)^2. This is referred to as the Pythagorean Expectation.
It works this way. Say the Dodgers scored 720 runs while allowing 640 runs. You square the 720 for 518,400, then square the 640 for 409,600 and add the two numbers together for 928000. Now we have 518,400/(518,400 + 409,600) or 518,400/928,000 = .558. So the Dodgers should win 55.8% of their games over the season. This means if they played 170 games, they should win 95 of their games.
Furthermore, the application of the Pythagorean Theorem in Baseball is used to determine how far the second baseman has to throw to home or third base has to throw to third. The baseball diamond is 90 feet from base to base so that makes it easy to calculate the distances. If you'd like to do an activity on Baseball, this site has the worksheet and answers one could easily use in the classroom.
Wednesday, October 10, 2018
Basic Statistic Information
 Math is Fun is a great website for introducing students to basic statistical information. It has topics from "What is Data" to different ways to show data, to setting up surveys, to measures of central distribution, to measures of spread, probabilities, to types of distributions. Basically everything you need in one place.
I really enjoy the organization of the topic and the way its handled. For instance the lesson "What is Data?" begins straight off explaining qualitative vs quantitative complete with examples. It further defines the two types of quantitative data with examples so students have a better idea of the difference. The lesson takes time to talk about collecting the data including information on sampling. The sentences are short with lots of pictures, highlighted words and at the end, there is 7 question quiz on the material presented.
Each question is multiple choice with a help button available. The help button takes the student back to the material. Once the question is answered, the program gives immediate feedback telling you why its right or wrong and tells you the percent of people who got the question right. I love the immediate feedback. At the end of the quiz, you find out your overall percentage and which questions you missed. Unfortunately, the questions remain static so if you retake the quiz, the questions are the same. At the bottom of the page are links to more information.
In addition, there are four hands on activities spread throughout the unit. One of the activities is on asking questions followed by a second activity on writing better questions which can be used to collect data. These have lots of examples but still ask the students to create their own questions based on certain criteria.
Under measures of spread, you'll find the usual range but the topic also covers quartiles and the interquartile ranges, percentiles, the difference between mean and statistical deviation with access to statistical deviation formulas and calculators.
Comparing data covers univariate and bivariate data, scatter plots, outliers, etc. Furthermore, the site has advanced information sprinkled throughout the list, so students are able to explore topics in even more detail.
I love the way each topic is set up with definitions, examples to support the definitions, links to important vocabulary and ideas. The lessons are fairly short and are easy to understand. I will be the first to admit that I only took one statistics class in college and that was quite a few years ago. So when I have to teach a topic, I'm rusty on, I go here to get a quick review.
I want to use this site instead of the book because the material is easier to take notes on since most of my students are ELL and need the site's organization to take notes easier than trying to get them out of a book.
Check it out and let me know what you think.
Tuesday, October 9, 2018
How The Brain is Changing
 I've been hearing from more and more people that the use of digital devices is changing the way we think and the way our brain works. Last spring, the local high school ran a documentary on this exact topic. I wish I'd been able to go but they ran it when I was off at a conference.
The current research indicates that the growing use of technology can both benefit and harm the way children think.
Remember, the brain continues to develop to about the age of 26, when it has reached its adulthood. In young children, the brain is malleable and growing, the wiring of their brains is being changed by frequent exposure to technology. Every age has had technology that changed the brain. For instance, when reading became more wide spread, the brain became more focused and imaginative because we pictured the words in our minds. One good thing out of the growth of current technology is that brains are able to scan through information more efficiently.
There are four main areas effected by the rise of technology: attention, information overload, decision making, and memory/learning. Attention is what allows us to think and leads to decision making, problem solving, creativity and other things. It is highly malleable and influenced by its environment. So children's type of attention is formed directly by its environment. Unfortunately, constant exposure to the internet has lead to distraction being considered normal, focused attention impossible, imagination is not needed and memory doesn't develop normally.
I've seen how imagination is inhibited because most of my students go to the internet to find pictures to recreate rather than developing their own ideas. They'll spend hours finding quotes they like to turn into posters. They look for apps to solve their math problems rather than developing the ability to approach the problem in a variety of ways.
In fact, studies indicate when a person reads text without interruption is able to do it faster, have better understanding, recall, and have learned it better than those who read the same material filled with ads, hyperlinks, and videos. Furthermore, there is a body of evidence to show that students who are on the internet during a lecture remember less of the lecture and scored fewer points on the same material as those who didn't have internet access.
Technology is good in terms of improving visual spacial abilities, the ability to identify only important pieces of information, and increase both reaction times and attentional abilities. Today's students are less likely to remember the information they find on the internet but they are more likely to know where to find it. In addition, if the brain doesn't have to remember as much information, it is thought that it might open the brain to participate in higher order thinking skills but they are not sure.
So if the attention span of your students is shortening, this might be the reason for it. There is now a generation of students attending school who have spent their whole lives being entertained by their mobile devices.
Let me know what you think, I'd love to hear. Have a great idea.
Monday, October 8, 2018
Statistics and The Real World.
 Over the next couple of days I'm going to be exploring sources for statistics we can use in the classroom when we hit that part of the school year where we have to include touch on it. Most schools I've taught at do not have a class on probability and statistics. We are expected to include it in our regular classes which means, I have to figure out where it fits.
There is also the problem of finding statistics that have been done in a reasonable way rather than adjusted to fit the presenters point of view. In addition, most students see the problems in textbooks to be stupid. They see no relevance but today, I'm sharing math lessons created by the United States Census Bureau for grades K to 12. If a child is old enough, they might remember the census workers who visited in 2010. The next time they are due to visit homes is in 2020.
The link will take you to the Math page where it lists all the exercises with a name and the type of analysis used for the activity. For instance, one says "Fitting a line to data - earnings and educational data. This lesson is suggested for grade 8 but it could be used in high school easily. It lists the learning objectives, materials needed, time required, and an activity description along with both teacher and student printed material.
The teacher packet is 15 pages long. It has everything listed on the main page, plus lists the common core and NCTM standards the activity meets. Furthermore, it lists which of Bloom's Taxonomy adjectives it meets and provides information for before and the activity before including all of the student pages complete with suggested answers.
All data is at the end of the three part activity. Part one requires the student to plot the number of years of schooling with the average earnings, draw a line of best fit before finding the equation of the line based on y intercept and slope or two points. Students are asked to compare the equations they came up with and discuss them.
The second part has them graph the same data broken down by sex. They find the equation of the line for men and women before comparing their lines with the one from part one. The final part of the activity requires students to write a one paragraph summary based on the data they plotted in parts 1 and 2.
If you are looking for an activity for a specific grade level, there are tabs listing K-5, 6-8, and 9-12 so it is easy to find the right one. They have activities designed to help students learn more about frequency distribution, applying correlation coefficients, interpreting dots and box plots, creating and interpreting histograms, sampling means and viability, and looking at what is a statistical question.
In addition, the site provides teaching resource including data access tools which has three lessons designed for students to use some of these tools in class, games, warm-ups, and so many other resources, some are for math, some aren't.
Check it out, see if you can use any. I've seen several including the one I explored, I can integrate into my math classes this week. Have a great day. Let me know what you think, I'd love to hear.
Subscribe to:
Posts (Atom)