Tuesday, April 30, 2019

Math News and Writing

Newspaper, Article, Journal, HeadlinesIt's sometimes difficult to integrate writing into math.  Yes, one can use journals, or writing prompts but there is a much better way of integrating writing into math and that is by having students read and then summarize articles either for publication in classroom magazine or into a journal.

I came across this idea in the article "Reading and Writing in the Math Class" by Alessandra King in Edutopia.  It was published on October 30, 2018.  In it, she discusses having students select math articles from the free app, Math Feed, summarize them and publish them in a classroom magazine.

She requires each student to read the article, summarize it, upload it with information on where they got the article from.  She then grades each student for understanding of the material, clear communication, editing, critical thinking in regard to the article and several other things.  She includes this as part of their overall grade.

There are lots of sources for finding mathematically based articles.  New York Times, Washington Post, The Economist, The New Scientist, Scientific American, or you can check out some digital sources who gather all the articles into one place.

1.  Mathfeed is a free app for apple devices.  The creator, Francis Edward Su, developed this app so it brings together articles from newspapers, influential blogs, podcasts, videos, and puzzle columns.  He did this while president of the Mathematical Association of America so it also includes their publications.

2. Math News from Phys.org has assembled math news into one location.  I saw one article where someone performed a statistical analysis on Beowulf and concluded it was written by a single author.  Another article analyzed over 4 million pitches to determine the rate of mistakes umpires make. I'm sure students would find one they liked.

3. Science Daily has a page filled with mathematical news.  They publish a few each day but have a long list under more mathematical news.  I saw one article about bee's being able to do basic math.

4.  Scientific American also has a page dedicated to mathematical news, starting with one on the mathematics of hacking. Another article uses data to determine which movies had the most influence on society. They looked at 47,000 movies to see which ones were referenced the most beginning with Gone With the Wind, followed by The Wizard of Oz and more.

5. New York Times has a page listing all the articles dealing with mathematics from the perfect formula of a heart at valentines day to the first women to win the Abel prize for mathematics.

6. The Independent over in the UK has a page with articles on mathematics. One articles states that 26 is the best age to get married at least as calculated by mathematics while another article looks at the perfect way to cut a pizza mathematically.

There are other sites out there you can use, all you need do is type in Mathematical News into the search engine.  If a student does not like the choices, have them find an article that interests them, check it out and decide if its a decent one.  If so, let them do it.  If your students have a lower reading level, check out Newsela because they have some math articles that can be found at three different reading levels.

One reason to include writing is that the act of writing involves both sides of the brain, the side that generates ideas and the side that puts the ideas into a structured form.  Furthermore, the slow pace of writing allows the student to construct their thoughts properly before writing.  In addition, writing helps clarify student thinking before they put their thoughts on paper and student writing gives the  teacher a chance to assess their understanding.

I plan to use this next year in math class to help improve reading and writing.  I've decided to let them create a video summary if they want but they still have to turn in a written summary.  Let me know what you think, I'd love to hear.  Have a great day.

Monday, April 29, 2019

Time for Prom

Interior, Luggage, Prom, Reception, PromWe have come to the time of year when students celebrate the end of the school year by attending a prom.  The prom at my school happened last night.  Usually the local prom is open to students beginning in 7th grade on up.  Sometimes folks from the village attend.  The prices are usually $20 per couple in formal, $25 single in formal, $25 per couple in casual, $30 for a single in casual. This gives students a four hour dance with food and music.  Usually, they arrive on snow machines or on an ATV.

Their cost is usually for the tickets, dress, shoes, or suit and tie.  Some of the boys borrow their suits from older brothers or even their fathers so overall the cost is not that much.  The girls get their hair done by friends, aunts, mothers or cousins, so again little or no cost but that is not true of most other proms.

This is the perfect opportunity to have students create a spread sheet covering the cost of everything associated with the prom.  For the girl, it would be the dress, her make-up, hair, jewelry, and shoes.  For the boy it would be the transportation such as a limo or car, suit, shoes, tickets, perhaps even a room at the hotel where the prom is held.  There might be a cost for a dinner before the prom or an activity after the prom.

I would be interesting to compare the prices they paid with the national averages.  According to an article with money magazine, the average cost of attending the prom in 2013 was $1,139. The average dropped to $978 in 2014 and dropped again to $919.  According to a survey done by American Express, going to a wedding is likely to cost between $703 and $893.

Furthermore, the cost of attending the prom varies according to part of the country, and location within that area.  A person is more likely to spend more in New York City than in Topika Kansas.  If you lived in the northeastern part of the country, you would be likely to spend over $1,100.

 In addition, according to another survey, families who made less than $25,000 spent almost $1,400 for the prom while those who earned over $50,000 per year spent closer to $700.  The thought behind this discrepancy is those in the under $25,000 knew this might be the only big thing the children would attend so wanted to make it special.

This site shows the change in the average cost of proms from 1998 to 2014 as compared with the general consumer prices.  He even offers a spread sheet called Prom Price Index which people can change amounts to see how the overall price changes.

This site looks at 23 different statistics concerning prom both in the United States, Canada, and other seas. This goes so far as to look at how much of the prom costs parents will cover, cost of shoes, dresses, etc, and amount spent based on income.  It also looks at external costs of prom based on alcohol consumption.

Lots of fun stats to use and compare.  Let me know what you think, I'd love to hear.  Have a great day.

Sunday, April 28, 2019

Warm-up

Former Prison, Historic, Building

If the building is 150 feet long, 80 feet wide and 125 feet tall, how much paint will be needed to repaint the outside of the building.  Do not worry about the windows.

Saturday, April 27, 2019

Warm-up

Iceland, Waterfall, Seljalandsfoss

If the equation for the distance water falls is d=16*t^2 where t represents time and d is distance, how far did the fall if it took the water 6 seconds to fall to the lake.

Friday, April 26, 2019

Square Root Day

Mathematics, Formula, Physics, SchoolSquare roots are found all other the place in math classes.  Aside from finding the square root of a number, one of the most familiar uses is in the quadratic formula for finding roots of quadratic equations.  One of my coworkers is finishing off a math class and she's been using this formula a lot.

Did you know there is an unofficial holiday referred to as Square Root Day?  Its only been around since 1981, when Ron Gordon held the first square root day on September 9, 1981. Ron Gordon was working as a high school drivers ed teacher at the time.


It was noticed that September 9, 1981 when expressed as 09/09/81 made the perfect square root because 9 x 9 = 81 and 9 is the square root of 81. If you look at all the days in a century, you'll discover that only 9 days meet this criteria. For the 21st century, these are the square root days.

  • February 2, 2004 (02/02/04): 2 X 2 or 2² = 4
  • March 3, 2009 (03/03/09): 3 X 3 or 3² = 9
  • April 4, 2016 (04/04/16): 4 X 4 or 4² = 16
  • May 5, 2025 (05/05/25): 5 X 5 or 5² = 25
  • June 6, 2036 (06/06/36): 6 X 6 or 6² = 36
  • July 7, 2049 (07/07/49): 7 X 7 or 7² = 49
  • August 8, 2064 (08/08/64): 8 X 8 or 8² = 64
  • September 9, 2081 (09/09/81): 9 X 9 or 9² = 81
The last one occurred on April 4, 2016 and the next one won't be for another 6 years on May 5, 2025.  now for some fun facts about square roots.

1. The first square root sign first appeared in print back in 1525 in the book Cross which also contained the modern + and - for addition and subtraction.

2.  Yale University has a Babylonian Tablet containing the value of the square root of 2 to nine decimal places.  The table is about 4000 years old.

3. The Rhind Mathematical Papyrus, dating back to 1650 BC, shows that Ancient Egyptians had the ability to calculate square roots, along finding slopes.

4. There are clocks out there that show the time in square roots such as noon is the square root of 144.

5.  Even Ancient India had a way of finding square roots and they used square roots as far back as 800 BC.  

I stumbled across this holiday and when 2025 comes around, I'll be ready to celebrate.  Let me know what you think, I'd love to hear.  Have a great day.

Thursday, April 25, 2019

Reading in Math

Knowledge, Book, Library, GlassesMy students hate to read in general and they hate reading textbooks.  I suspect much of their dislike has to do with their low reading levels.  Over half of my high students are still reading at about a fifth grade level.  So I've had to include reading as part of what I teach.

The cool thing about reading is that it is a two stage process, just as learning math.  The first stage involves the transfer of encoded information to the reader and second, the reader needs to understand the material.

Unfortunately, reading math text does not always involve the reading skills normally taught in English or in reading classes.  Reading math often requires skills specific to math itself.  I know, I was never taught to teach students the reading strategies needed to successfully read a text.  I'm also aware, most elementary teachers do not teach those strategies to their students so students get to high school without that ability.

The differences in reading a math textbook vs a regular book are many.  For instance, research indicates that sentences in math textbooks have more concepts per sentence and paragraph.  This means the material is extremely information dense.  These sentences are filled with lots of information but little repetition.

Another difference is that many sentences contain both numeric and non-numeric symbols laid out in paragraphs that may be in different arrangements with graphs, examples, and other visuals making it more difficult to read using the usual left to right eye movement.

In addition, math books often have sidebars with information that may or may not be relevant to the topic.  The material in these sidebars may be confusing to students because most English textbooks do not have any so a student may not know how to sort through them.

Furthermore, most math textbooks do not follow the standard form of topic sentence and support sentences for each paragraph as found in most other paragraphs.  In a math textbook, the key idea is at the end, not at the beginning.  This is especially true for word problems, when the sentence asking students to find something normally appears.  It its important for the student to read through the material to find the "main idea" before rereading to find the "support" information.

There is also the problem of vocabulary and the words having slightly different meanings within the context.  For instant 3 - 2 to many people is read as "three minus two" but it can also mean "three plus a negative two".  Both the same thing but the second way often confuses students.  In addition, words often have a meaning in English and a different one in Math so students have to know both meanings.

Add to that, the use of certain small words in Math such as "of" and "off" or "a" meaning any number, or something "of" for say the area of a rectangle, meaning inside not multiplication.  There was a study done where students were specifically taught these small words, and their ability to do math improved because they understood the differences.

There is a specific set of strategies students can use with a math textbook to improve their reading.  First students can preview the text by looking at the title, all headings and subheadings and using it to activate prior knowledge which in this case might be where they've used it before or done something similar. Students could also write out questions they have about the topic based on their previewing.

Next they figure out the major concept covered in the material along with determining is they know the specialized vocabulary, and see if they can connect it to real life.  At the same time, the teacher can prepare by finding the major concept and are their pieces in the reading they may not have the vocabulary or are unable to figure out the meaning through context.  The teacher also needs to know if they need to use supplemental materials to improve understanding of the topic.

It is important to use a variety of graphic organizers from the Frayer Model for new vocabulary words to analysis grids for separating the characteristics of quadratics or other shapes, to a flow chart on processes.

One source suggests teaching students to use the  SQRQCQ for word problems.
Survey - Read the material quickly to get a general understanding.
Question -  Question yourself to figure out what the problem needs to be answered.
Reread - Reread the problem to find the details needed.
Question - Ask what operations need to be performed in what order.
Computations - Do the calculations.
Question - Does the answer look reasonable?


I've taught my students the "Kentucky Fried Chicken Wings" method to answer questions.

K - What do I know?  What information did they give me?
F - What do I have to find?
C - What else do I need?  What formula?  What operations and in what order?
W - Do the work and find the answer.

This is an introduction to integrating reading instruction into the classroom.  Let me know what you think, I'd love to hear.  Have a great day.


Wednesday, April 24, 2019

Compromise with calculators.

Accountant, Accounting, Adviser, AdvisorI have a class of 9th graders who are so far behind, they test at about a 3rd or 4th grade level on everything from MAPs to MobyMax. Today, I discovered why they do not seem to know their multiplication tables or have trouble adding and subtracting.  The middle school math teacher let them use a calculator for all math that required a numerical answer.

At this point in time, I do not have the time to fully remediate their weaknesses and get them up to speed, so I've figured out a compromise to help them learn the processes but still allows the use off a calculator.

Right now, I have groups of students practicing their long division such as two digits into three digits or two digits into 5 or 6 with a decimal.  Say the problem is 452/28.  I let them use the calculator to do 45/28 so they know how many times it goes which is 1 and something.  They take 1 x 28 and put the answer - 28 below the 45 and then subtract.  Again they may use the calculator to subtract to get 17.  They write the 17 below and then bring down the 2 so they have 172.

They again divide 172 by 28 to get a whole number.  It is 6 times and a remainder so they can multiply 6 x 28 to get 168 which they write below 172 so they can subtract and get a remainder of 4.  The problem would look like this.

     
This way, the students show the work following the standard algorithm while doing the correct math and experiencing success instead of getting frustrated because they don't know their multiplication tables.  It's going much better because the students are willing to try and they are no longer spending all their time trying to remember their multiplication tables 

I am doing the same thing with the students who are dividing a two digit whole number into five or six digits with a decimal in it.  This group instead of complaining and refusing to work is willing to follow this method.  

I hope by doing it this way, they learn more about the process without getting stuck and discouraged. I am doing it out of desperation because if I make them do it without the calculators too many students give up and shut down.

Let me know what you think, I'd love to hear.  I don't know if this is the best choice but its worth a try.  Have a great day.


Tuesday, April 23, 2019

Simple or Compound Interest.

Percentage, Percent, Digit, DiscountIts funny but when we teach math, we teach both forms of interest, simple and complex, but we don't usually take time to explain which is used more often and with what.

The actual definition of simple interest is the interest calculated on the principal while compound interest calculates interest on the interest.

For the borrower, simple interest is better because it means you pay less money overall while you'd prefer compound interest if you invested your money so you'd get more back.

There are at least four places in real life that charge simple interest when you borrow money from them. The first involves a car loans.  Most people borrow money when they need to purchase a new car so when they borrow it, its usually a simple interest loan. For a car loan, the company loaning the money, calculates the total amount of interest on the loan as simple interest but arranges payment so most of the interest is paid over the first part of the loan before the principal is paid off.

Another situation is when you get obtain a loan from a department store to buy some appliance such as a refrigerator, you are given one year to pay it off at a specific interest rate while paying equal monthly payments.  On the other hand, if you invest money in a Certificate of Deposit, the interest you earn is calculated using simple interest and set for a specific period of time so you cannot withdraw the money before the time is up without paying a penalty.  In addition, most mortgage loans are also simple interest unless they involves negative amortization.

On the other hand, most credit cards calculate interest using  the compound formula because the amount owed varies, consequently, they prefer to compound interest daily due to the changing balances.  In addition, the stated minimum payment is set so a person will never pay the money off without paying a lot of interest.

For investing, if you can arrange to reinvest any and all interest earned on money, you can create something resembling compound interest because each time its calculated, the amount of money its calculated increases because of the interest added to the principal.  In this situation, you are truly earning interest on the interest and compounding the interest.  This is considered one of the best ways to increase your money.  This is also great for investing into a retirement account.  At the beginning it doesn't seem like much but after a few years, it begins to increase much faster.

Another use of compound interest is in business when a company takes the profits and reinvests them rather than distributing them to create larger dividends in the future because the interest is being earned on the interest that was added back in.

So there you have it.  Where simple interest is used and places compound interest is used.  Let me know what you think, I'd love to hear.  Have a great day.


Monday, April 22, 2019

What Are Tax Refunds Spent On?

Taxes, Tax Office, Tax Return, FormIt has been a week since the April 15th Income Tax deadline and some people are already receiving their tax refunds.  In 2018, about 70% of those who filed received a refund but no one is sure about the number of refunds in 2019 due to  changes in the law.

When people were polled on how they planned to spend their refunds, about 27% stated they would use it to pay down debts.  This is nine percent less than in 2018.

Nine percent planned to make a major purchase while another nine percent want to put the money in a non-retirement saving account, and nine more percent plan to invest the monies.  Only seven percent want to deposit it into their retirement account while an equal number want to spend the money on a vacation.  Only three percent hoped to spend their refunds on luxury items.

The amount people want to invest or spend differs according to their age or sex.  Its interesting that the 25 to 34 age group is more likely to invest the money, make a major purchase, or pay off a loan than any other group.  On the other hand the 35 to 44 age group tied with the 55 to 64 group for depositing the money into a retirement account.

If you go to this site, it has the information broken down by age group and sex for both 2018 and 2019.  Both graphs give students a chance to practice reading and interpreting information.  Its also set up in a way, students can use the information to create graphical representations of results.  They can also use the numbers to create a visual representation of the increases and decreases between 2018 and 2019.

The site also has information on the expected amount of refunds which range from $2021 for the 55 to 64 age group up to $5,400 for the 65 and above group.  On the other hand, about 50% of the 18 to 24 age group do not expect a refund while only 26% of the 55 to 64 years old do not expect a refund.

If you want to have students create a tax breakdown by state where they list number of tax refunds issued, the amount, and the average amount in 2017, check out this site.  There is enough information for students to create graphical representations showing a variety of information. They can also create a ratio of number of tax returns per state to the population of adults over the age of 18.

Lots of real world data to be analyzed and turned into a report much as others might assemble the information so companies or stores might know how much each group has so they can plan an advertising campaign that might appeal to certain age groups.

Let me know what you think, I'd love to hear.  Have a great day.

Saturday, April 20, 2019

Warm-up

Swimmers, Swimming, Race, Competition

The pool is 15 feet across by 25 feet long by 8 feet deep.  If there are 7.48 gallons of water in one cubic foot, how many gallons will it to take fill the pool?

Friday, April 19, 2019

Easter Graphs and Infographics

Easter candy poll
found at https://www.omaha.com/living/new-poll-reveals-the-most-popular-easter-candies/article_1a48946c-a609-5b36-87d9-dd6d2611c3b8.html

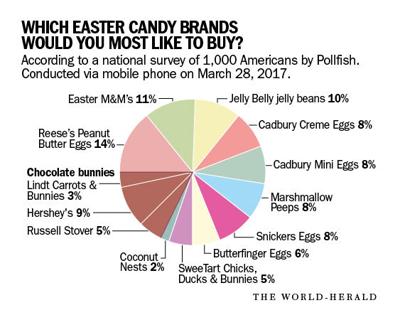
I ran across this graph on the internet.  It breaks down the brands of candies most people prefer to buy at this season.  Pollfish surveyed 1000 Americans via phone to accumulate the information.  Since the survey sample is composed of 1000 people, students could easily determine the number of people who selected each type of candy.

On the other hand, this site has eight different infographics.  These infographics could easily provide the basis of one or more compare and contrast activities where students work to determine the information that is the same or different.

This site has 10 different infographics dealing with Easter.  They range from popular Easter breads, to  information on Peeps, Easter eggs and jelly beans, to information about rabbits.  I love the one which compares the number of Easter eggs or jelly beans that can be stored in various places from canning jars to the space shuttle, to the Death Star from Star Wars.

If you'd like to give students a chance to have a bit of fun while practicing their coordinate graphing, head off to this site where they have several Easter themed activities. They have several  Easter Bunnies and Easter eggs set up to cover all four quadrants.

Sorry this one is a bit shorter than normal.  I'm trying to pack a house and get through the last three weeks of school.  I am moving to another district where I'll be teaching high school math there and I'm looking forward to it.  I'll be back to normal entries on Monday.

Let me know what you think, I'd love to hear.  Have a great weekend.


Thursday, April 18, 2019

Negative Prime Numbers? Yes, No, Maybe So

Roll The Dice, Craps, Board Game, Points The other day in class, one of my students asked me if prime numbers could be prime.  That question stopped me cold because I've never given that particular topic any thought.

The student thought if the definition of a prime is one and the number itself, then - 3 could work because it would be 1 and -3.  I told him, I'd investigate but I didn't think it would work that way.

After a bit of research, the answers I received were yes, no, and maybe depending on how you looked at things.  Now for the break down of all the answers.

1. I'll handle no because that is the one we are all familiar with.  According to this definition, all prime numbers must be greater than one and negative numbers are less than one. Also the definition is based on natural numbers and natural numbers do not include negative numbers so again they have to be positive.  This definition was made back in the time of the Greeks who only dealt with positive numbers.

Based on an activity I read about, negative prime numbers would not work.  Using manipulative, prime numbers will always have one left over after arranging the rest in a rectangular or square shape.  All composite numbers can be arranged in a rectangular or square shape with no left overs.

2.  Yes, there are negative prime numbers but you have to go into a very special branch of mathematics for this to be true. If you assume that for the statement -a divides b when every a does, they are then treated as the same divisor.  The numbers that divide one are called units and the two numbers a and b for which a is a unit time b are referred to as associates.  So the divisors a and -a of b are associates.  This means that -5 and 5 are associates because they represent the same prime.
Basically, if you begin looking at numbers within a ring structure, you can have negative prime numbers.

3. Maybe so because as you've seen it is possible to have them in ring theory and a few other areas of math but does it really matter since most standardized tests use the normal accepted definition.  They don't usually focus on things like ring theories.

If you are a bit rusty on things, Ring theory is a set with only two operations, usually addition and multiplication that meet certain criteria such as additive and multiplicative identities, additive inverses, addition being commutative, and the operations are associative and distributive.  It came out of Algebraic Number Theory and are generalizations and extensions of integers and algebraic geometry.

Just a bit of background on ring theory since within that part of mathematics, there are negative prime numbers.  Let me know what you think, I'd love to hear.  Have a great day.

Wednesday, April 17, 2019

Algebraic Thinking In Elementary School - Patterns

Emoji, Emoticon, Smilies, Icon, FacesYears ago when I did my student teaching, the local schools were introducing a type of math that focused on introducing algebraic thinking to students in elementary.  Recently, I've seen more and more problems which encourage algebraic thinking using Star Wars characters, emoji's, and other fun characters.

The idea is for a child to look at the first line and determine the value from it before subbing that value into the second line to find the second variable and then into the third line for the third variable.

Its all algebra done with pictures instead of the usual variables.  I find them fun and I think they are a great way to introduce algebraic thought to all children.  The National Council of Teachers of Mathematics believe it is good to begin teaching algebraically  to children in kindergarten.  An important over all concept is making connections among ideas such as patterns, classification, functions, expressions, equality, variables, relationships, and proportional reasoning.

The question arises of where to begin.  There are places to begin, even in kindergarten, teaching children algebraic thought. For instance, it is possible to introduce the idea of finding patterns to young one.  The patterns do not have to be mathematical in the sense we think of patterns but it could be just finding patterns in their clothing, or in the tiles on the floor or the pattern in the carpet.  If you expect the children to verbalize the pattern they see and then draw it, you've taken the first steps towards becoming mathematically literate.

Another activity is to hand students manipulative of some sort and have them create two different patterns out of them.  When everyone has finished the assignment, allow students to wander around the room, checking out everyone else's patterns.  Instead of a gallery walk, you have a pattern walk.

Then the teacher could pass out blank paper and crayons to each child.  In struct students to create a repeating pattern of 5 items using shapes such as circles, or squares.  At the end, have students divide into pairs, exchange papers, and each student will try to figure out the next item in the pattern.

The above ideas work with younger children but for the older ones in say third or above, you could try introducing them to a game where you give three clues to the value of X and then they guess the value of X.  The clues might be X + 6 = 8, X + 0 = 2, and X + 2 = 4.  What does X equal?

When giving students equations, change your wording. Rather than reading  4 + 2 = 6 as 4 plus 2 equals 6 or 4 plus two makes an answer of six, try four added to two is the same as six.  Vary your vocabulary so they do get the idea that the "=" sign allows one side to have the same answer as the other side so when you write 6 + 2 = 4 x 2.

These are just a few ways to introduce algebraic thinking in elementary classes so students doe not find it so hard to transfer knowledge when they begin algebra.  Let. me know what you think, I'd love to hear.  Have a great day.


Tuesday, April 16, 2019

The Math of Plant Nurseries

Corn, Seed Starting In ContainerIts the time of year again when people pop down to their local nursery to purchase starts.  Many of the nurseries in Alaska won't actually be selling starts until early May since the last frost date is pretty late.  I have friends in the lower 48 who already have things planted and are almost ready to harvest peas and such.

According to the Nursery Management site, pricing starts and other plants is like a chess game.  There are many factors when setting the cost.

First, one must calculate the production costs which include seeds, water, pots, soil, fertilizer, transportation, marketing, and overhead costs like the green houses, employees, etc.  It is important to create a system such as a spreadsheet or computer program that allows the owner to type in changes and know instantly the current production costs.  Its also extremely important to have a detailed cost accounting system.

Most nurseries use the results of the production costs to determine the markup for retail or wholesale prices.  The markup is usually standardized per item such as all gallon sized plants have a 200 percent mark-up while five-gallon plants only have a markup of 150%.

Markup percentage = (price - cost)/cost
so a 200 % markup = (price - $1.37)/$1.37
$4.11 = price - $1.37
price = $5.48 is what they'd sell it for.

Then the nursery owner will round the price up to a better psychological price.  Most people prefer a sales price ending in 99 because it makes it seem as if you are getting a deal so the company might raise the sales price to $5.99 or if they really want to try to stimulate sales, they might drop it to $4.99 but most would go for the $5.99 price.

Another thing they need to keep an eye on is the life cycle of the product.  Most plants will grow and eventually die so as a nursery owner, you'd want to sell most plants before they get too big.  So the idea is to sell the product at full price before the plants get too big.  At some point, most nurseries begin discounting the prices but they still have to keep in mind the break even point between the cost of raising the plants and when they begin to make a profit. The bottom line is that when the owner begins to sell discounted plants, they need to sell more to make money.

If the person shopping knows little about the plants they are buying, they tend to look at price only but if the nursery is able to convince the buyer that they are getting additional value for the price, they are more likely to pay the additional money.  In the past, I've paid more for starts because they were varieties proven to grow better in Alaska.  Many plants I can buy at the major chain stores are not meant to be gown up here.

Additional value might mean you are given information on how to plant the start so you increase the chance it will survive, or perhaps recommending the proper fertilize.  If a nursery wants to raise the price of any of their stock, they should do it in the early stages of the product's life cycle because people are usually more willing to accept the increase.

These are all factors that plant nurseries need to consider when pricing plants to see each spring.  These are things I never thought would be involved.  Let me know what you think, I'd love to hear.  Have a great day.  

Monday, April 15, 2019

Easter Candy Sales.

Bunnies, Shit, Chocolate, SweetsAfter Halloween, Easter is the second most popular holiday for candy.  According to a report by the 2017 National Retail Federation, Americans spent $18.4 billion on Easter candies.  This is a six percent increase over 2017.  It also represents around 146 million pounds of sweets.

Although Valentines day is associated with candy, people spent 0.2 billion more on Easter Candy than they did for Valentine Day candy.

Now the 146 million pounds of candy breaks down to about half a pound of candy for every person in the country.  It is also equivalent to over 11,000 African bush elephants.  In addition, the candy sold at easter accounts for more than one third of the seasonal candy sold. Seasonal candy is classified as candy sold during specific times such as Easter, Halloween, or Valentines day and accounts for 17 percent of the candy sold annually.

The National Retail Federation site has some great data teachers can incorporate into the lessons for this time of year.  They provide historical information on the number of people who celebrate Easter from 2009 to 2019.  They have another graph for average amount of money spent per person over the same 10 year period and the total dollars spent by everyone who purchased candy during that period.

That is just for candy.  They also provide graphs indicating how much is spent for candy, clothing, food, flowers, etc for the 10 year period broken down as percent of population, total expected spending, per person spending, how they are celebrating.   They also include a break down for 2019 demographics by gender, age and region.

These graphs allow students to read, interpret, and prepare reports based on the information.  I think I'd begin with having students look at the data before formulating questions they have about the data before they analyze it.  They could also take the data and transform it into infographics to share with others.  Furthermore, you could have students calculate the annual increase or decrease over the 10 years.

On the other hand, this site has a great infographic for how much money was spent at Easter in 2018, covering everything from gifts and candy to traditions and live animals.  The infographic is easy to read and would give students a great chance to read and interpret its data.

If you prefer predone activities, Yummy Math has several ready to do.   One activity has students try to make a low guess for the number of Peeps sold at Easter, another guess that is too high, and a third you think it really is.  The exercise is set up to have students discuss what they need in order to make proper guesses and at the very end, the teacher will provide the amount sold.

Have a great day. Let me know what you think, I'd love to hear and I hope you have a great day.

Saturday, April 13, 2019

Warm-up

Umbrella, Parasol, Shade, Striped, Blue

If this umbrella has a parabolic shape with a radius of 3 feet and a depth of 6 inches, what is its equation?

Friday, April 12, 2019

How Early Math Learning Effects Life Long Brain Development.

Brain, Mind, Psychology, Idea, DrawingIt is well known that if a child is not on grade level by the end of third grade, they will struggle with reading, writing, and math and they are at increased risk of never graduating.

One of the elementary teachers stated that third grade is when students move beyond the foundation math to more complex things.  This, in his opinion, is why they struggle as they get older.

One study discovered it is not your over all ability, but your childhood memory which effects your ability to do well later in life.

They study claims that children who learned their facts solidly did better later on because more of the  memory is utilized rather than the counting part of the brain as they age.  In other words, if children do no memorize their facts, they may never get past counting on fingers and toes.

Stanford university ran an experiment where they used MRI to determine which part of the brain was used as they did mathematical problems.  They began doing this with children aged 7 to 9 to see whether they used the memory or counting part of the brain.  They noticed that as children aged, the brain moved from counting to fact retrieval and adult brains relied on fact retrieval rather than counting.

In fact, the brains between second and third grades showed major changes in problem solving.  After third grade, the brain acquires new patterns of neural communications among regions involved in numerical thinking and working memory.  Furthermore, the way the brain is activated changes over the year.  It is not the regions that change but the way the brain responds to simple and complex problems.

In addition, the brains actually change as it adopts more sophisticated strategies for solving problems.    The study discovered the brains of third graders showed more differentiated responses between the simple and complex problems.  The brains of the third graders also showed more interaction between the two areas as students learned new math skills.

Another study discovered that the posterior parietal cortex,  the ventrotemperal occipital cortex, and the prefrontal cortex are the three parts of the brain that can be used to predict improvement in math.  It was found the more grey matter, the more likely the person would perform better in math.  Furthermore, they found even the simplest mathematical task uses all three parts of the brain and its the way they work together that's important. In other words, they work together, speak to each other, the better your brain is able to do math.

Scientists are hoping to learn more about brain development in regard to math understanding so they can develop better ways to teach math to students.  Let me know what you think, I'd love to hear.  Have a great day.


Thursday, April 11, 2019

Queuing Theory In Detail

People, Group, Crowd, Line, SilhouetteAs noted yesterday, people lining up at amusement parks is a perfect example of queuing theory.

Queuing theory is defined as the mathematical study of waiting in lines and congestion.  It looks at every stage of waiting from arrival to how to arrange things to the end.

We see its application at amusement parks most of the time but its also applied at banks, grocery stores, airport security, or waiting on the phone for help.  Its also applied to computers and communications when queuing theory is applied to make sure information travels efficiently.

Queuing theory got it's start back in the early 1900's when Danish mathematician A. K Erlang explored the best number of circuits and switchboard operators needed to offer decent phone service for the Copenhagen Telephone Service. The resulting paper, published in 1909, proved that arrival's in queues could be modeled using the Poisson process.

In 1934, an American Engineer, figured out a mathematical framework for switching packets which allows information to travel the internet in modern society.  It is also responsible for keeping the movement of phone calls, streaming videos, etc.  Over the years it has been applied to traffic engineering and hospital emergency room management.

The mathematical description comes down to a queue with arrival time A, service time distribution B,  and servers C or the A/B/c/S/N/D queue.  The arrival time A actually looks at the time between arrivals and is subject to the Poisson distribution while the distribution B looks at the total number of items in the whole system including those in the queues.  S stands for the time it takes a customer to be serviced while c represents the number of servers in the system. N specifies the total number of customers, and D is the type of system such as first come first serviced or first in last out.

For a single server, this follows an exponential distribution but in real life, there are usually multiple servers so it gets a bit more complex.  This information is applied to call centers so that the number of operators handling the calls is set to make it as efficient as possible because the cost of operators is the most expensive part of running a call center.

On the other hand, Little's Law which states the average number of of items in the queue is found by multiplying the average rate at which items arrive in the queue by the average amount of time spent in the queue. It tends to be more generalized than the previous law meaning it can be applied to many systems regardless of the of the type of items or the way they are processed.

When you have more than one "server" you end up with networks that have to have queuing theory applied to.  We often see "networks" as we deplane airplanes, make our way to the next plane or to the baggage area, or checking in at ticket counters, move through security, and boarding airplanes.

With these types of activities, queuing network theory has developed.  There are two types of networks, those that are open, and those that are closed.   Open networks are defined as a system where customers can enter or leave at more than one place whereas a closed network has a fixed number of customers.  Closed networks include things like a set number of software licenses for computers where an airport is a great example of an open network.

So now you know more about queuing systems and their applications in real life to situations other than amusement parks.  Let me know what you think, I'd love to hear.  Have a great day.


Wednesday, April 10, 2019

Amusement Park Math

Fairground, Lights, Amusement ParkSummer is heading quickly our way and this is the season most people head off to enjoy amusement parks of all sorts.  Some such as Disneyland, Knott's Berry Farm and Seven Flags over Texas, while others are strictly local or are part of a carnival wandering from town to town.

Each one of these parks provide a wonderful opportunity to explore all sorts of amusement parks, rides, etc to see where the math is.

If you've ever been to Disneyland, you've had to weight in lines but the company has taken great pains to make the wait much easier.  It is what I call the mathematics of handling large groups of people so the ride itself is not slowed down but is actually an application of queing theory.

For instance, on many rides such as Tom Sawyer's Island Rafts, each raft can take a set number of people so park employees designed the waiting area so the correct number of people were grouped. When the raft arrived at the loading area after discharging the previous trip, it could be quickly loaded with the preset group.  As soon as the raft took off, another group was assembled for the next raft.  The groupings made the loading and discharging smooth. In other rides, the waiting line may be wide but there is a U-turn at the end which naturally funnels people into a narrow line making loading the ride so much easier.

Another use of mathematics is to figure out how to move say 500 people out of a theater after a show while moving another 500 people into the theater.  I classify theater as the building housing a show or  a ride that uses a closed room that functions as a space ship.  The closed area does not move so they have to move people in one side and out the other.

Most amusement parks use data mining to predict the movement of people through the park.  In addition, it helps the company determine the pricing for the facility.  Will they offer a daily rate, a package of several days with special activities or without.  Many rides are classified as simulator rides where a specific experience is simulated for people such as the Star Wars ride.

Then there are the various rides, many of which get a pull up to the top of the first hill and then released so that the energy powering the ride is provided through the curves and hills of the ride.  If things are too steep, the cars won't get up the hill, if they aren't steep enough, the ride will poop out soon.

One site such as this one.  It takes students step by step through the process of designing a roller coaster beginning with the first hill, its height and slope, the height of the second hill, a loop,  and at the very end, the site gives you a rating on the safety and fun rating. The site explains why your choices may not be safe.

Let me know what you think, I'd love to hear.  Have a great day.

Tuesday, April 9, 2019

Koch Snowflakes.

Ice Crystal, Snowflake, Ice, Form, FrostKoch Snowflakes are a well known of fractal often used in Geometry and proposed by Swedish mathematician Neils Fabian Helga Van Koch in 1904.  Its also known as the Koch curve, Koch star, or the Koch Island.

To get a Koch Snowflake you start with a line that is divided into three equal parts and turned into an equilateral triangle.  The process is repeated off sides until you get the final product.

In detail, the math behind it is quite interesting.  The number of sides equals three times four to the a power where a represents the iteration.  When a = 0, n = 3.  When a = 1, n = 3.  When a = 2, n = 48 and when a = 3, n =. 192.

In regard to the length of the sides, they are always one third the previous length or mathematically it is x * 3^-a where a is iteration.  Thus for the first four iterations where a = 0, 1, 2, 3, you get length = a, a/3, a/9 and a/27.

All though this the perimeter is the same no matter the number of iterations.  The formula for the perimeter is n * the length or p = (3 *4^a) * (x *3^-a) simplifying to p = 3a (4/3)^a.  Simple sweet and easy.

Now if you are teaching a math class where students are not as advanced in the math department, can still draw a decent representation of the Koch snowflake without calculating the math for each iteration.

Step 1.  Draw your first equilateral triangle in the middle of the paper.


Step 2. Draw one  equilateral triangle off the middle third of each side so now you have what looks like two triangles, one behind the other.


Step 3. Draw one equilateral triangle of the middle third of each side of every triangle so it looks like there are three layers of triangles.


Repeat until you have the fractal done. Normally you'd only draw the outside of the triangles but I used color so you could see what was happening.

So with just a few triangles, you have a fractal. Let me know what you think, I'd love to hear.  Have a great day.


Monday, April 8, 2019

More On Real Life Trig.

Math, Trigonometry, MathematicsThe nice thing about trigonometry is that it is extremely easy to find real life examples.  Not the ones in textbooks where you have to place a ladder against the wall or figuring out how tall the flag pole is.  Most of my students consider them stupid.  They ask why would anyone needed to do that when you can measure the ladder by placing it on the ground and pull out a tape.

Trig is the ratio between angles and lengths of triangles.   Last week, I discussed using trig to determine if the armor was thick enough on a battle ship.  My students loved doing that exercise and found it fun to do because they actually used the definitions of sin and cos to do this.  One wants to be an engineer and he really liked it.

There are other places trig is used in real life that most textbooks do not use.  Such as in architecture where they rely on triangular supports or in engineering when they have to determine the length of the cable used between posts on bridges.  Its also used in calculating the length of a roof, figure out weight loads, and find the footage of a curved piece of land.

Then in music sound waves follow sin and cos waves.  One note produces one sin wave while a chord is made up of several sin waves.  These waves also help sound engineers when they adjust amplitude, pitch, or other characteristics so they get the proper sound.  In addition, trig helps people place speakers for optimal sound quality.

Electrical Engineers use trigonometry to model alternating current where the current flows one direction before changing to travel the other direction.  In addition, they  use the sin wave to model voltage.  This is for all lights and light switches, televisions, and any other electrical appliance.

Furthermore, trig is used in manufacturing to determine the size and angles of parts used in tools, machines, and equipment.  It is also used in calculating the correct size of each part in automobiles and that the parts work well together.  Trig is also used to create certain parts for clothing such as darts, gussets, and triangular pattern pieces.

In Astronomy, scientists use trigonometry to determine the distance of planets and stars from earth.  Trig has also helped NASA send men to the moon, gotten space craft to various starts and planets.  Trigonometry is also used when people create video games.  They need it to move characters around in a world created using the same math.

Trig is also needed when pilots are calculating their landing or take off.  If the angle is off, they could crash or run out of runway.  Sin and cos waves are used in CAT scans and MRI in medicine.  Its used in seismology, crystallography, number theory, and all sorts of engineering and other avenues.  Its used all around us.

Let me know what you think, I'd love to hear.  Have a great day.


Sunday, April 7, 2019

Warm-up

Monastery, Hallway, Ancient, Building

If each window is 8 feet wide and each solid area is 6 feet wide, approximately how far are you from the back wall?

Saturday, April 6, 2019

Warm-up

Canned Food, Can, Cylinder, Gold, Metal

The radius of the inner most cylinder is 6 inches, the middle cylinder is 7 inches and the outer cylinder is 8 inches.  What is the difference in volume between the inner cylinder and the outer cylinder?

Friday, April 5, 2019

5 Ways to Improve Mathematical Literacy

Book, Reading, Love Story, Story, Roman When I was in school, they didn't worry if we were not mathematically literate.  They were more concerned with following the process to arrive at answers.  They didn't care if you understood the concepts behind solving equations.

In recent years, there has been a move towards having students read about the concepts, write about the concepts and be able to display visual representations of the concepts.

There are so many ways to have students read, write, discuss, and represent mathematical concepts so they are mathematically literate.  I include discussion because it's important for students to express their thoughts verbally.

1.  Have students work a problem from their homework or from an assignment.  Give them a chance to explain their way of solving it to others.  Many teachers will ask students to do this on the board in front of people but some students are extremely shy.  This is when something like Flipgrid comes in handy because students can record themselves explain the problem while not feeling as if they are singled out.  This can also be done via a voice over animation or other creative way.

2. Have students explain a problem they answered incorrectly.  Have them show exactly where they made the mistake, what they should have done, and rework the problem till they get the correct answer.  They can also take time to explain why they made the mistake.  This can be done via Flipgrid or via a voice over. 

3. Let students create quizzes and answer keys based on the current material using any number of quiz making software.  The teacher can arrange to administer a quiz made from student quizzes to administer to everyone, or assign students into pairs and they can take each other's quiz.

4. Have students create a video explaining the current concept as if it would be posted to Youtube so others could watch it and learn.  This type of activity requires that students plan what they will say and how they will cover the material.

5. Have student answer a question on an exit ticket using a QR code to convey the information  or provide a quick answer via email or answer on google classroom.  In the exit ticket they can explain why they need to do something, or reflect on something from the day's lesson.

These are 5 digital ways to improve mathematical literacy in the classroom.  Let me know what you think, I'd love to hear.  Have a great day.


Thursday, April 4, 2019

The History of Fractals

Fractal, Spiral, Endless, MathematicsFractals are seen everywhere but is a fairly recent branch of mathematics.
Although the concept of a fractal has been around for a long time, Benoit Mandelbrot was the first person to define it in 1975.

The first hint of fractals appeared in the seventeenth century when Liebniz explored self similarity but only with a straight line.  The next reference came in 1872 when a mathematician produced the first graph resembling what we call fractals.  The man who produced this graph used an abstract and analytic definition which Helge Van Koch hated.  So Koch used a geometric definition which produces the Koch Curve or Koch Snowflake.

Shortly after, Waclaw Sierpinski created his famous triangle and carpet.  Over time, many others continued exploring this topic but without computers it was difficult to create a picture showing the true beauty of fractals.  Benoit Mandlebrot came up with the term "Fractal" which is from the Latin term "Fractus" meaning broken or fractured. He is considered the father of Fractals.

One type of fractals are the Mendlebrot Fractals named after Benoit Mandlebrot.  In this set, they basically look at how the complex functions behave when repeated multiple times.  This particular fractal has lots of heads and legs called "brots"

The form of the function is f(z) = z^2 + c but it involves a lot of complex numbers with a, b, and i. Remember i. is the square root of -1.  For each c, they begin by placing 0 in for z and two things happen.  Either it gets larger and larger moving away from zero or it stays close to zero and never going very far.

A second type of fractals are the Julia fractals discovered by Gaston Julia around 1915.  He investigated the equation f(z) = z^4 + z^3/(z-1) + z^2/(z^3 + 4z^2 + 5) + c which has lead to several commonly used functions such as zn+1= c sin (zn), zn+1 = c i. cos(zn), and two others.  Julia fractals are mapped from each pixel to a rectangular region of the complex plane.  It starts at the pixel.  If it goes to infinity, the area is white but if it does not, then its black.

There is a relationship between Mandlebrot fractals and Julia fractals.  If the c is inside a Mandlebrot set, it is connected and if they are from outside the set, they are disconnected and appear as dust.

The third type of fractal is the Newton fractal which is based on Newton's Method - used to find roots of functions.  It appears as xn+1 = xn - f(xn)/f'(xn).  The xn converges rapidly to f(xn).  If you use colors to represent the type of root such as red if it converges to -1, green if it goes to the complex root on the right side or blue if it goes to the complex root on the left side and black if it doesn't converge at all.  The shade of the color is determined by how quickly it converges.

So now you know the three main types of fractals and the mathematics associated with them.  I'll be delving into the Koch Snowflake another time because it is one that can easily be incorporated into the classroom.  Let me know what you think, I'd love to hear. Have a great day.


Wednesday, April 3, 2019

The Mathematics of SnowFlakes.

Flake, Snow, Snowflake, Snow FlakeLiving in Alaska, I see snow flakes so much of the winter.  I see them when they fall gently from the sky or when the wind rips it across my face.  I see them piled all over my porch after a night of snow fall and I swear when I have to shovel it off the porch.  We all know that no two snow flakes are alike but that still doesn't mean there is no math involved when talking about them.

By definition, a snowflake is an ice crystal that follows a specific pattern as it grows. It begins with a single ice crystal in the center with smaller crystals growing on the sides eventually creating a more complex shape.


Snowflakes are beautiful, mathematically speaking due to patterns, symmetry, and breaking of symmetry.  If you define a pattern as a repeated design, then snowflakes meet the definition.  If you've ever had the chance to examine them, you'll see beautiful patterns.

One man, Wilson Bentley, aka the Snowflake Man, took pictures of snowflakes through out his life and examined each one until he died.  This man made the comment that no two snowflakes are alike. He based the comment on his examination of thousands of snowflakes.  Everyone who has tried to find a counter example to disprove the comment have not succeeded.

Snowflakes range in shape from small hexagonal prisms, to needles, to columns, to what we think of as snowflakes with their hexagonal shape like in the picture.  These more complex shapes grow from the hexagonal prisms.  In fact, mathematicians see snowflakes as fractals.  The most famous one is the Koch Snowflake created by Helge Von Koch.

Most large snowflakes display symmetry in their hexagonal shape.  The cool thing about this particular type of symmetry is that if you rotate the snowflake by 60n degrees, it is exactly the same.  In addition, if you look carefully, most snowflakes have multiple lines of symmetry, usually a 6 fold symmetry.

It is possible to perform computer modeling which produces a fairly accurate picture of naturally produced snowflakes.  For instance, Reiter's Model creates shapes found in nature as certain variables are changed.  Gravner and Griffeath refined Reiter's model so that it looks at whether the cell is frozen, semi liquid, ice or vapor so there are more control variables and the computer produced dendrites and plates look like those found in nature.

If you'd like to see more of the computer modeling paper on Reiter's Model and the second one, look here.  Keep your eyes on here because in the near future, I'll discuss Koch's snowflake in more detail and how to draw your own, using equilateral triangles.

Let me know what you think, I'd love to hear.  Have a great day.


Tuesday, April 2, 2019

Income Tax Rates.

Taxes, Tax Office, Usa, America, FlagIts that time of year again when in less than two weeks, people's income tax and any payments are due.  Some people have to file an extensions while others have theirs done and in as soon as possible.

While researching the history of Income Tax, I came across some great information for mathematical activities.

For instance, this site has every income tax form published by the government from 1913 to 2018.  The first couple of forms had a maximum tax of 7 percent for income over $500,000.  Over the next few years, the maximum tax rate jumped to 77% due to having to finance WWI.

This site gives a quick look at how the top rate bounced up and down according the the needs of the government.  Students could use this information and a spread sheet to create a graph visually showing the history of tax rates.  At the bottom of the page, they have their own graph showing the top tax rates which students can read and interpret.  They can determine if the tax rates are going up due to a major event such as war or dropping due to a depression.  Integration of social studies and math.

This site has all the years with tax rates for 1913 to 2013 so students could easily make graphs for each year showing the break down of percentages with income, perhaps even use stacked graphs to show the information.  The information is clear and easy to read to it would be easy to utilize the data to analyze.  The same information is available here in pdf form.

What is interesting is that taxes rates up till 1948 applied to everyone regardless of their marital status.  In 1949, married filing jointly appeared and they were charged less while everyone else paid the higher amount.  In 1952, Head of Household appeared as a new category so they had one rate, married filing jointly a different rate and married filed separately and single paid the same higher rate.

Up until 1955, married filing jointly was stated to be half of married filing separately.  In 1955, they got their own column with rates while singles still paid the same as married but filing separately.  In 1971, singles got their own column.

Every year provides rates based on percent and taxable income so you can see what the maximum amount charged each year.  This provides all the detailed information. If you just want students to look at maximum amounts, these tables have all the information needed to produce a graph.

Use this site to provide information on corporate tax rate since 1909 so students can do a compare and contrast of personal vs corporate tax rates. They can also create a spread sheet to show the rates in comparison with personal tax rates.

When I started looking at tax rates, I never knew I could find the information on tax rates from the beginning of the 20th century till quite recently, nor did I know it would be enough to create a social studies connection.

Let me know what you think, I'd love to hear.  Have a great day.


Monday, April 1, 2019

Math and April Fool's Day.

April, First, April Fool'S JokeOver the years, people have experienced a variety of April Fool's jokes, some of which have a mathematical twist or flavor to them.    If nothing else, they are fun.

In 1980, The BBC managed to convince the public that Big Ben would be converted from its analogue form to have new digital faces.  People protested only to find out it was a hoax.  The BBC is known as pulling some good stunts over time such as "harvesting spaghetti" or "smell-o-vision" which allows the television watcher to smell whatever is shown on their screens.

Two years later in 1982, The BBC ran a story of a once in a life time event in which Pluto would end up behind Jupiter, creating a unique cancellation of Earth's gravity so if people leapt into the air at exactly 9:47 AM, they'd experience a weightless sensation.  The BBC received calls from people who claimed they'd floated including a group who stated, they'd floated up to the ceiling.

Capital Radio in 1979, claimed the government would have to implement "Operation Parallax" to allow time to resynchronize itself.  Apparently, the United Kingdom had gained a total of 48 hours due to the country flipping onto and off daylight saving's time.  To catch up, the country had to cancel April 5th and April 12th to get the United Kingdom back in line.  People fell for it.

In 1975, an Australian news show announced the conversion to metric time.  They had a metric clock with a 10 hour clock face to show the world.  The new metric clock had a conversion rate of 100 secs = 1 min, 100 min = 1 hour and 20 hours = 1 day. The Australians were quite upset with this.

Another prank happened when it was announced that the state of Alabama decided to round pi to 3.0 which is what the Bible states.  The "news" made the rounds and upset a ton of people before they found out it was a prank.

Of course there was the one where a mathematician sent out an e-mail on April 1, 1997, claiming a solution had been found a proof for the Riemann-Hypothesis.  It excited so many mathematicians but they were disappointed when they discovered it was nothing more than a prank.

As you can see, even math cam't escape having April Fool's pranks played on it in some way.  Have a great day.