 |
| found at https://www.omaha.com/living/new-poll-reveals-the-most-popular-easter-candies/article_1a48946c-a609-5b36-87d9-dd6d2611c3b8.html |
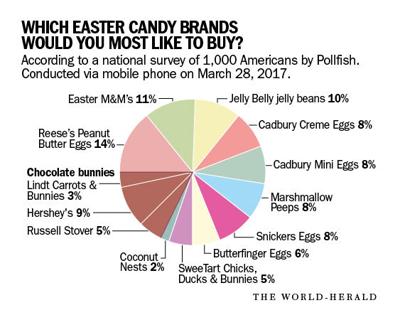
I ran across this graph on the internet. It breaks down the brands of candies most people prefer to buy at this season. Pollfish surveyed 1000 Americans via phone to accumulate the information. Since the survey sample is composed of 1000 people, students could easily determine the number of people who selected each type of candy.
On the other hand, this site has eight different infographics. These infographics could easily provide the basis of one or more compare and contrast activities where students work to determine the information that is the same or different.
This site has 10 different infographics dealing with Easter. They range from popular Easter breads, to information on Peeps, Easter eggs and jelly beans, to information about rabbits. I love the one which compares the number of Easter eggs or jelly beans that can be stored in various places from canning jars to the space shuttle, to the Death Star from Star Wars.
If you'd like to give students a chance to have a bit of fun while practicing their coordinate graphing, head off to this site where they have several Easter themed activities. They have several Easter Bunnies and Easter eggs set up to cover all four quadrants.
Sorry this one is a bit shorter than normal. I'm trying to pack a house and get through the last three weeks of school. I am moving to another district where I'll be teaching high school math there and I'm looking forward to it. I'll be back to normal entries on Monday.
Let me know what you think, I'd love to hear. Have a great weekend.
No comments:
Post a Comment