
Sunday, February 9, 2020

Saturday, February 8, 2020
Warm - up

A new born zebra weighs around 65 pounds yet by the age of 2 the male weighs 700 pounds. What is the average weight gain per week over the two year period?
Friday, February 7, 2020
The Price of Super Bowl Commercials.
 The Super Bowl just happened this past weekend. I understand the Kansas City Chiefs won and yes I'm a bit late on it but I discovered something about the cost of Super Bowl commercials after I read an article of the best and the worst ones broadcast.
Since the first Super Bowl the cost of a 30 second commercial has increased significantly since 1967, The first broadcast ran advertisers about $37,500 or when calculated for inflation is equal to $292,903 today. The latest Super Bowl is estimated to run an advertiser about $5,600,000.
Since the first Super Bowl charged $37,500 but by 1973, less than 10 years later, the cost hit $100,000 and by 1995, the cost was over $1,000,000. Within 5 years, the cost jumped to over $2,000,000. Then by 2011, the cost went to $3,000,000, and by 2015, it was over $4,000,000. Now it is heading towards $6,000,000.
This Sports Illustrated site has a list of costs of of 30 second commercials beginning in 1967, all the way to 2020. It does not have every year but it has enough years to create a nice graph using original costs or the costs adjusted for inflation. Students could calculate the percent increase based on costs again adjusted for inflation and graph it.
On the other hand, this site has the cost of add for every year from 1967 to 2020, rather than just a select number. It said the first Super Bowl cost $47,000 rather than the $37,500 and I've seen it both ways. This data could be used to create a general graph showing the increase from the first Super Bowl to the current one.
Students could also calculate the percent increase or decrease each year from the first bowl to the current one so they can see which years were steeper than others. They could break the cost down per minute and compare those.
On the other hand, if they used the number of viewers listed here for each Super Bowl, they could investigate the number of viewers who saw the advertisements and calculate the cost per viewer for the commercial or the increase in cost vs the number of viewers.
If you want to give students a bit more choice, let them explore these sites and then suggest a project they would like to do using the data they have. There are always going to be foot ball fans in the class who would love to explore this topic because they can relate to it.
I admit, I'm not a football fan and only know when the Super Bowl happens but I enjoy analyzing data so you might get some kids who are interested in that. Let me know what you think, I'd love to hear. Have a great day.
Wednesday, February 5, 2020
Justifying Your Work in Math
 We are always telling students to justify their work, explain their work, and show their work but how often do we take time to teach students to do this. I've been focusing on having students "show" their work because it is a way to communicate their thinking. I do need to work on having them explain or justify their work and that is a bit different.
First, you need to inform students of your expectations on what constitutes justifying your answer. Do you want them to label everything? Do you want them to show only calculations or do you want everything including the drawings or models included. Do you want them to explain how they arrived at their answers in words discussing each step and their thoughts? Do they need to explain how they made sure their answer was correct? Put the answers to all these questions on a chart so they can refer to it every they have to justify their answers.
Second, provide each student with a smaller sized chart of their own containing everything they need to include in their answers. These are the same things you have on the large chart in your room but every student has an individual copy to use.
Once students have these tools, they need multiple opportunities to practice justifying their answers. This might be taking a word problem and breaking it down into chunks so students have a chance to answer each part and explain how they arrived at the answer. Furthermore, it is possible to write the questions so they are differentiated to meet all the abilities of the students.
Regularly incorporate opportunities for students to justify their answer when using word problems and regular problems. Students need practice justifying their answers in both situations because they often need to do this for all sorts of tests. In addition, they need to develop the vocabulary necessary to communicate their thoughts so others can see their thinking.
In my opinion, justifying your answer is being able to write more than just a phrase or identify the property that allows you to do what you did. It is being able to show understanding of when and why certain things. are used to solve problems.
Furthermore, this process needs to be started down in elementary school rather than waiting till students reach middle or high school. If they start early, it will become second nature to students and they won't fight it in the upper levels. This also helps them develop the ability to ask focused rather than general questions.
Let me know what you think, I'd love to hear. Have a great day.
Monday, February 3, 2020
Changes in Prices of Nuts.
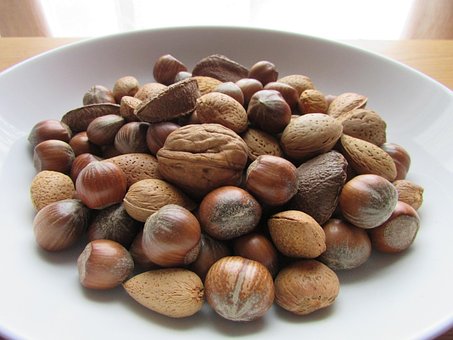 Most people I know absolutely love eating nuts. All sorts of nuts like almonds, hazelnuts, pistachios, walnuts, and pecans. They eat them straight, add them to desserts, quick breads, butters, and make non-dairy milks. Often, I complain about the costs with my friends because they seem so expensive but how much do growers get?
This opens the doors to a real life project using information on how much growers receive versus how much nuts are sold for. For instance, the average price for a pound of nuts increased from $4.63 per pound in 2011 to $6.07 per pound in 2016. This information comes from this graph.
If one wants to look at the prices for individual nuts, that can be done. This site allows one to see how the prices of in shell almonds changed in California from 2014 to 2020. It provides prices at least once a month or sometimes twice and includes the percent increase or decrease. The site also includes a graph showing the same information so students can see it visually too.
On the other hand, one can look at the change in prices for walnuts in Spain between 2013 to 2018 here. Furthermore this graph published the prices for both shelled and unshelled walnuts per kilo. This site focuses on walnut production in California. It has great graphics on the price per pound farmers receive for the years 2000 to 2017. In addition, it has graphs on California walnut production, walnut yield, acreage used to grow walnuts, farm value of the nuts, value of exports per unit, and projected values for 2018. Great information to use on a compare and contrast presentations.
Ycharts has graphs for pecans, walnuts, almonds, pistachios, and hazelnuts. Each graph covers average yearly prices beginning in 1996 to the present. Not all charts use the same unit of measure. The information on hazelnut production is based on metric ton while pistachios are per pound. Not all the data listed on each page appears in graph form so it is easy to have students graph the complete data while calculating the yearly increase or decrease.
The last site gives students a change to perform more calculations in the spreadsheet, have additional data to analyze for trends and patterns while offering an opportunity to see what happened in the real world to create the changes in price. If students can discover what happened to create the cost to rise or fall, they are on the way to understanding the economics of supply and demand.
In addition, since the unit measurements are different, it means students have to practice converting crops into the same unit to be able to compare and contrast the cost, increases or decreases in percentages.
This is something that uses real life data to see changes over time. Let me know what you think, I'd love to hear. Have a great day.
Sunday, February 2, 2020
Warm-up
If one pound of pods produces 1.25 cups of peas, how many pounds do you need for 15 cups of peas?
Saturday, February 1, 2020

Subscribe to:
Posts (Atom)