Tuesday, October 31, 2017

Halloween Math.

Halloween, Pumpkin, Dark, Art, Fantasy  Happy Halloween to everyone.  Most of the time when I've gone looking for Halloween based math, the ones I find are all geared for elementary school.

 I want problems geared for a higher level and which are more interesting than "Jane has 8 pumpkins.  She gives 3 to John.  How many pumpkins does she have left?"  My high schoolers are not interested in those.

So after some searching I found some lovely problems geared more for middle school and high school students.  Problems that are a bit more interesting.

1.  The worlds largest pumpkin weighs 2222 pounds in 2017.  The average pumpkin weighs 12 pounds, how many pumpkins does the largest pumpkin equal.

2.  The record for the distance a pumpkin has been thrown in the chuckin contest is 4484 feet.  What percentage of a mile is that? 

3.  The first Halloween parade happened in 1920.  How many months till it celebrates its centenial?

4.  Buy a couple packages of pumpkins from the seasonal section to create a matching game.  You might create matching games where one student multiplies two binomials while the other factors a trinomial.  The students do the math then look for who they match.  Another possibility is to create equations in pairs so they get the same answer. Another possibility, one card has the equation while the other has the graph to match the equation.

5. The Census bureau has some wonderful data concerning Halloween such as the number of potential Trick or Treaters ages 5 to 14, the number of potential stops based on the number of housing units, number of units with stairs, number of people employed to make the candy, and other wonderful facts.

6.  How about an estimation activity to estimate the number of seeds in a pumpkin, estimate the circumference, estimate its weight.  After the estimations, have students count the actual number of seeds to determine the closest guess, then make spiced pumpkin seeds to eat in the class.  After finding the circumference, calculate the diameter.  Finally after giving the weight to the students, have them bake the pumpkin and use the pulp to make pumpkin bread to eat.  You can weigh the pumpkin when you buy it so you'll already know that.

7.  Have students create a haunted house on a coordinate. They can then give the location of items within the haunted house.  They can also find the distance between each part. 

8. Students can create graphs containing the name of the candy, the number of calories per serving and its weight in grams.  Once done, students need to calculate the number of calories per gram so they can determine the candy with the highest or lowest per unit values.

9.  Begin a Pascal's triangle with pumpkins.  There should be enough pumpkins on the paper to help students recognize the pattern so they can finish it.  It can lead to a great discussion on Pascal's triangles.

Just a few suggestions to make math and Halloween a bit more interesting.  Have a great day and let me know what you think.  I love to hear.
Monday, October 30, 2017

Pumpkin Chunkin

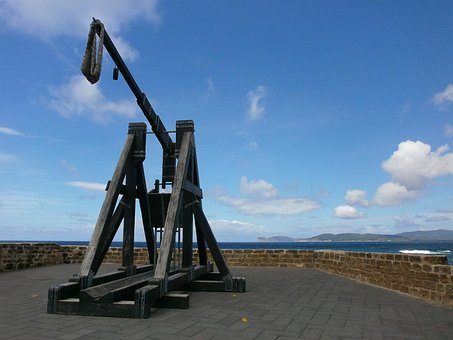
Catapult, Sea, Blue Sky  It is almost Halloween, the time of pumpkins and crazies who launch pumpkins with huge self built catapults.  This three decade old tradition raises funds for various groups and is due to happen the first weekend in November.

This event brings its followers in from all over the place.  I have friends who disappear for the weekend so they can go out to Delaware to watch.

There is some great math involved in this event from the parabolic projectile path to the time it takes for the pumpkin to travel across the field, etc.  Most people launch their pumpkins using some sort of air cannon to provide the force necessary to launch the object.

Lets start with finding the initial velocity by using the formula x*(k/m)^1/2 with m representing mass, k equals the spring constant, and x is distance in meters.  Since the pumpkin is being shot out of an object, you are dealing with projectile motion.  It is this motion which creates a wonderful parabolic shape. We can use the projectile motion equation d = (v^2osin(2theta))/g to find distance.  Add into this finding the time of the pumpkin's trip by using t = Vo sin(angle)

If they calculate the flight of the pumpkin without air resistance, then .  There is vertical and horizontal velocities, the angle of launch, and acceleration out of the cannon.  So you end up with the equation Vv= Vo sin(angle) and Vh =  Vo cos(angle).  A nice practical use for trigonometry.

If you add in drag, the equation changes to  drag = 1/2 * items density * speed^2 * area * drag coefficient.  Drag is what slows the object down and the area listed in the equation refers to the cross sectional area of the pumpkin which can be found using the equation pi * diamter^2/4.

Lots of cool math involved in shooting off a pumpkin. Yes it is mostly involves physics but its still the math involved when shooting a pumpkin.  So many things.  Just a fun fact, the pumpkin chuckers are still trying to hurl the pumpkin at least one mile but so far they have managed about 4,450 feet.

If you are interested in more math equations, just check out the internet for one of many articles with all the math equations needed to calculate just about anything to do with this event.  I chose just a few of the equations.  In addition, there are all sorts of plans to follow to build launchers.  Imagine having students build small versions of the launchers designed to launch those mini pumpkins.  Imagine having students follow up with the math to prove things. 

Let me know what you think!  Have a great day.  Tomorrow, I'm looking Halloween based math appropriate for use in the middle school or high school.


Friday, October 27, 2017

Pattern Blocks in the Secondary Classroom.

Roof, Brick, Colorful, Red, Roofing  My experience with pattern blocks is really next to nothing because I've only ever seen them used in the elementary grades.  I knew they could be used to teach parts of the whole but I never realized they could be used at the middle school and high school levels. 

I've actually discovered a few ways they can be used in the upper grades. I am thrilled because I have a collection of them from the previous teacher.    There are also a couple of apps for sale from the app store so you can use them on the iPad.

The first way to use them, is by having students create semi-regular tessellations using pattern blocks. Imagine having students using squares and blue rhombus. Or using two or more regular shapes to cover the plane in the same polygon order either clockwise or counter clockwise.

Let their creativity loose so they can create repeated patterns within a circular shape or a rectangular shape.

 Unfortunately, many students reach middle school or high school without a solid foundation in using fractions.  Pattern blocks are a good manipulative for teaching fractions in a way that might be more understandable for students.  This lesson found on better lesson is specifically designed to teach fractions to students using pattern blocks.  The lesson has an anticapatory set through the end activity.

The math learning center has a nice pdf filled with activities for grades 3 to 5 all designed to teach basic mathematical concepts from symmetry to angles.  In addition, Henri Picciotto has a free ebook filled with ideas including several activities which use pattern blocks to learn more about angles, polygons, symmetry, measurement, and similarity.  He also includes a presentation for using pattern blocks in the classroom, and a link for pattern block trains for teaching rates of change.

What about using pattern blocks to teach functions? Check out this pdf with an activity for creating functions.  The files include both the worksheets and the answers which is nice time saver. 

If you want to show mathematics and pattern blocks in a slightly different light, check out this place which equates the pattern block shapes with number of beats on a drum.  Its like using the blocks instead of notes for the music.  The smallest shape, the triangle, is worth one beat, the rhombus is worth two, etc.  It is easy to arrange for the use of drums out here because the drum is the basic instrument for dances.  The school owns several.

Let me know what you think.  Have a great day.


Thursday, October 26, 2017

Math Links

Chain, Metal Chain, Link I love exploring the internet because there are so many great sites for math teachers.  Every time I research something, I find a great site I can use in my classroom.

The other day, I found Math Links Network, a site filled with over 1500 links for teaching math. 

Each link has a picture, the date added, and the URL of the site so you can explore it.  In addition, the links are divided into one of six categories: Numeracy, patterns and algebra, data, measurement, space and geometry, and advanced.  When you click on the category, there is a list of subtopics at the top of the page letting you know how many links are in each. 

If you click on Space and Geometry, you'll see 16 sub topics such as triangles, circles, angles, etc.  I clicked on triangles with the 18 links listed.  Some of the links are for sites and videos I've never seen before and will provide additional materials for my classes.

There are other offerings by this site for teachers.  The Maths Faculty has 213 resources from other teachers, designed for teachers.  These resources are divided up into the same 6 categories as the links take the explorer back to many of the same links as the main page but not all of them.

I found a maths kit list of links grouped by type.  These categories are way different than the other pages in that they have links to graph paper, calculators, dice, equation editors, videos and other such topics.  Every grouping has at least three entries but most have 10 or more.  The site with the URL is listed for each link.

Another section offers different types of papers needed in the math classroom.  Papers such as coordinate grids, graph paper, Isometric dot paper, and number lines, trig graph paper and parabolic graph paper. Each section has several different types of the paper.  This is the place to go when looking for specialty paper rather than having to scour the internet.

The final section is the starters section with 13 different starters, timers and other things to make teaching a bit easier.

I admit, this site has so much on it, that I'll be a long time checking things out, determining which activities will work on the iPad and which won't.  I didn't know there was a site like this out there.  It appears to be from Australia but the links are worth investigating.

Let me know what you think.  I'd love to hear.  Have a great day.


Wednesday, October 25, 2017

Solve Me Moble Math

Mobile, Fish, Hanging, Toy, Animals Did you ever try to make a mobile in school when you were younger?  Do you remember how hard it was to get it to balance properly and when you finally did it, you celebrated.  Well, while reading up on emoji math, there was mention of something called Solve me Mobiles

Solve Me Mobiles math is an online math place developed by the National Science Foundation. It also works on both computers and iPads.  In addition, there is a free app available for the iPad if you don't want to use the browser on the iPad.The idea behind this site is when both sides of the mobile are balanced, the values are correct.  If the values are not correct, then it is unbalanced.

This site follows the same idea as the emoji math site except it uses basic shapes to represent values.  The site is divided into two parts, play and build. 

In the play section, the first 60 problems are designed to explore how this mobile algebra site works.  Some of the problems have totals while others have you make an educated guess.  The second section is the puzzler section with more complex problems such as 3x + 2 = 2x -4 represented by fractions.  The final section is the master section has 80 complex problems.The problems are designed to begin with simple problems moving to the more complex problems as a person develops their skills. 

The second part is designed to allow anyone to create their own balance puzzles.  It allows you to choose the shapes and the values for the shapes so you could actually take an equation and set it up on the balance to find the answers.  Its also great for just letting students explore the concept of equality between the two sides of the balance.

For more information on how to use this site in class, there is a short video on this web page on using it to learn the logic of solving systems.  The video is just over 2.5 minutes long. The creator of the video states their research indicates Solve me mobiles helps math students transfer knowledge better.

One teacher who uses this site in class as a warm-up, assigns specific problems to do before taking time to lead a conversation on which strategies they used to solve the problems.  I love this idea because it helps students develop their ability to communicate mathematical ideas.  In addition, it engages students and builds the knowledge they need to use in solving standard algebraic equations.

Another teacher who used this site had students build their own puzzles only after they created them on paper so they knew exactly what they wanted to create and to make sure it works.  Do a quick search and you'll find several videos out there on the site.

I love playing with the puzzles myself.  I'm think my students are going to have fun playing with this site and the emoji math site.  One thing I learned early on, is that if you send them to a web site, its best to put the URL in a QR code to make it easier for students to get to the site.

Let me know what you think.  Tomorrow, I'll be sharing a site I found filled with links for those of us who teach math.  Have a great day.


Tuesday, October 24, 2017

Emojis in Math

Emoji, Emotions, Face, Tie, Funny  In the latest issue of The Mathematics Teacher, I found an article on using Emoji's in the math classroom.  I had just had a chance to glance at the title before I had to go to work.

I had a student in my second period class who struggled with the concept of anything to the zero power is one.  She kept trying to get it but just couldn't break through.  So I remembered the title and started drawing different emoji's on the paper, all to the zero power.

After a few examples, she had it and could do it.  This supports what the author of the article observed.  If you give students the algebraic math problem in standard form, they struggle to solve it due the variables being too abstract and too far from their experiences.

When using emoji's instead, the same problem made sense to them because students relate to them since emoji's are a part of their lives.  In fact, students could often solve the algebraic emoji problems in their heads, yet couldn't solve them when the same problems used variables. The use of emoji's allow students to connect with previous knowledge and begin the first steps towards algebraic understanding.

I realize the use of emoji's instead of variables is quite different but does it really matter what the representation is?  I've had students suggest question marks or a square for the unknown.  Yes, using letters for the variables is traditional but if students are able to gain the concepts using emoji's why not.  Isn't it the concept that is important and not the representation?

This information first appeared in the blog of one of the authors.  The example shown is wonderful and lots of fun.  I found  Solvemoji's  which is an online site filled with emoji math problems that works on both computers and iPads.  I had a blast working some of the problems.  What is great is they have multiple levels of problems from easy to hard.  If your answer is wrong, it tells you and encourages you to try again.

Step one, let them "play" at the site solving several puzzles.  The second step is to begin translating the emoji math into algebraic style math with the emoji's. Third step, translating the problems into the algebraic format complete with the normal variables.

I think this is going to be a lot of fun.  Let me know what you think.  I love hearing from people.  Have a great day.


Monday, October 23, 2017

Google Tour Builder

Cycling, Bicycles, Sport, Racing, Tour  I love checking out twitter on a regular basis.  I learn so much and get ideas for things I can use in my math class.  Late last week, there was a post on the Tour Builder from Google that is in beta form.

It allows people to create tours based on where they've been or where they want to go to.  The tour incorporates google earth, photos, google street view, maps, videos to create a tour.

The reason I'm excited about this product is that it makes it easier for students to create tours based on mathematical themes.  I saw a tour for Kindergarten which showed students 3 dimensional shapes in real life.  There were some wonderful pieces of architecture contained within the tour.  Older students could make their own versions.

Several months ago, I wrote about two tours in the UK where people walked through areas of Oxford to see mathematically based buildings, etc.  Students could research mathematically inspired buildings and create their own tours via tour builder.  I know that most of my students will never leave the village or at least never get farther than Anchorage.  This type of activity shows them a world outside of Alaska, they will never see on their own.

The program allows people to connect slides to Google Earth, maps and sometimes Street view.  It allows students to place more than one image or set of text in each slide.  Students can add pictures they take or find on the internet.  The program allows videos to be incorporated into the videos.

I plan to have my geometry students use their cell phones to take pictures of geometric shapes, vocabulary, etc around the village.  I'll include a portion that they must take a video while explaining why they chose a certain item for their tour.  Its harder out in the village because we do not have anything hire than a one story building, even at the airport with its metal buildings large enough to house front end loaders.

Think about all the possibilities:
1. Basic geometric vocabulary with pictures from local places.
2. 3 dimensional shapes from around the world.
3.  Trigonometric applications such as surveying, in the real world.
4.  Graphs, charts, and other real world applications.
5. Math tours of certain cities.
6. Vectors and plane trips from one place to another.
7.  Taxi cab geometry.

There is this wonderful site with step by step directions to create a tour using the program and a multitude of resources geared to see what can be done with Tour Builder.

Let me know what you think. I'd love to hear. I hope to have my example put together later in the week so I can share it with you.  Have a great day.

Friday, October 20, 2017

Authentic Tasks

Question, Question Mark, Board, School  Today, I am looking at what makes a good authentic task.  Not every authentic task found on the internet are good.  I know many of the performance tasks are written to provide a single answer.

Authentic tasks allow teachers a way to make math relevant for the student by asking them to make real world decisions.

When looking at authentic tasks or trying to write one, it is best to remember there is a product involved because in real life an employee usually creates something and does not complete a worksheet.  The product might be something like someone in the government using census data to determine trends of growth or an environmental scientist who creates a policy paper.

When deciding if an authentic task is "real" apply the following guidelines:

1. It has a purpose and is engaging.  In other words, students have to see there is real value in the task.  They should want to do it.

2. Models how people solve real problems at work or in communities.  They should be designed to include negotiation, planning, action, reporting, evaluating and exploring of alternatives.

3. Has students apply their knowledge by drawing on skills and strategies from different areas of mathematics.

4. Allows students to demonstrate what they know and can do. Students should be able to contribute and they should be challenged.

5. Supports multiple representations and solutions.

6.  Offers opportunities for meaningful learning and allows students to use higher order thinking  strategies.  Students should be allowed an "aha" moment, be able to develop a number of problem solving strategies and skills, and allow for the construction and evaluation of conjectures, rules or generalizations.

7. Results in some product as a result of their deliberations.  At the end, they have a tangible result.

It is easy to find a variety of authentic tasks on the internet but not all of them are realistic or meet the above criteria.  Evaluate and determine if the task meets all of the criteria before assigning it.  I've found worksheets having students answer questions which fall under the category of error analysis not a proper task filled with interest.

Let me know what you think.  I love hearing feedback. 


Thursday, October 19, 2017

Word Problems in Context.

Math, Kids, Thinker Unfortunately, too many word problems found in textbooks tend to be artificial and constructed to meet the math being taught at that moment.  The unfortunate side effect to this is students look for the math to apply rather than starting with the word problem itself.

Lets look at the process involved in solving real world problems starting with the context rather than the math.

We are given a mathematical problem in context.  From that we formulate the mathematical application and its uses to the real world problem.  This includes taking the situation and translating it into a form which we can identify the mathematics needed to solve it. The next step is to use any mathematical formulas, processes, procedures, reasoning, facts or tools required to find the solution.  The final step is to interpret and or evaluate the answer to determine if the solution is reasonable.

This is directly opposite of the normal way of doing things where we teach some math, have them practice the math, finally applying the math in a situation where the math has already been set up for the student.

We as math teachers can step away from the textbooks, to provide open ended real texts and real situations so students  have a chance to make connections between math and its use in the real world.  We can provide students with those messy problems and help them learn to extract the information needed to identify the mathematics needed to solve it, and when students stumble, use that to determine what needs to be taught.

As part of providing these types of experiences, there has been a creation of authentic tasks which require students to demonstrate their knowledge by applying it to real world problems.  A good task bridges the gap between the classroom and understanding its applications outside of the classroom.

Tomorrow, I'll be discussing how a good authentic or real world task is built. Let me know what you think.


Wednesday, October 18, 2017

Geogebra AR (Augmented Reality)

 The other day, I heard that Geogebra now offers an augmented reality app which superimposes shapes over the background seen by the camera.  You snap and can capture the scene.

When you point your camera at something you can choose to insert basic solids, the Penrose triangle, the Sierpinski pyramid, a football, 3d function, Klein's bottle, and a ruled surface.

This first shot is one of the shapes from the basic solids.  Before I took the picture, there is a set of instructions telling students to take pictures of pyramids, prisms or consist of only triangles. 
In addition, with two fingers, I can move the group of shapes around so I can see all sides of each element in the photo.

I can move in closer as you can see with the photo to the right.  I can get close enough to see everything in detail.

I can move out to see the whole shape in context so there is a lot of flexibility.   By moving in closer, I can take a picture of the one or move out and get a picture of the whole group.

The shot to the left shows the group looking sideways so you see it as if they are all in the same plane.  Side note here: I took all these photos from my front porch, overlooking the lake. 

The shapes float over the grassy edge between the marshy area and the lake itself.  Since you can move the shapes around, it is possible to take photos of each shape from all sides.


The photo to the right was taken looking straight down at my carpet.  This indicates the app is able to orient the objects to the direction the camera is facing.

From this way, you can see what the objects look from overhead which makes it easier for students to see how pieces fit together. 

I usually have students create their own nets for various shapes but they often have trouble because they have never really paid attention to how the shapes are put together.

 This app would allow them to take one shape, explore it before working on creating the netting needed to recreate the shape out of paper.

Unfortunately, I have not found any developed lesson plans other than the instructions found at the bottom of view screen.

Keep your eyes peeled because next week, I'll be doing a column on using Augmented Reality in the math classroom.

I hope every one has a great day.  Let me know what you think.


Tuesday, October 17, 2017

Mathematical Activities Using the Aurora.

Aurora Borealis, Northern Lights  The one thing I love about living in Alaska is seeing the Auroral displays in winter.  Yes, it can be extremely cold but many times the displays are so awesome, its worth standing in -40 degree weather to enjoy.

Its always nice to have activities lined up to help students understand more about the mathematics behind the aurora.

Before starting either lesson, I'd show the videos from this page as a way of introducing these beautiful phenomena to students who might not have a chance to see the lights in person.

For instance, NASA has a lovely 56 page activity guide geared for grades 7 and 8 with several mathematical activities such as plotting satellite data on a polar map to see where the auroral belt is located.  Another uses geometry to find observing latitude for auroral displays.  There is an activity using a clinometer to find the height of an object in the classroom while another has students using triangulation to find the height of the aurora.  There are four more activities which use math and deal with the aurora.

Each activity comes complete with objectives, sample questions, a list of materials, worksheets, demonstration information and teacher notes.  Although it is geared for 7th and 8th graders, this could easily be used in the high school with little alternation.

The Utah Education Network has a great activity that uses a circular grid to plot zones of auroral activities.  It takes the students step by step through the activity to analyze the northern nights.  When they've completed this one, there is a worksheet for students to use to analyze the southern lights in the same way.  I like that this activity has them using a geographic circular grid to provide a reference. 

Most of the activities in both sets of activities have students learning to find points on a geographic coordinate grid which gives them exposure to a different use of coordinate points.  In this case, the x and y values represent longitude and latitude, a use most of our students are never exposed to .  It puts the graphing into a real contextual use.

Let me know what you think.  I'd love to hear.

Monday, October 16, 2017

The Droste Effect.

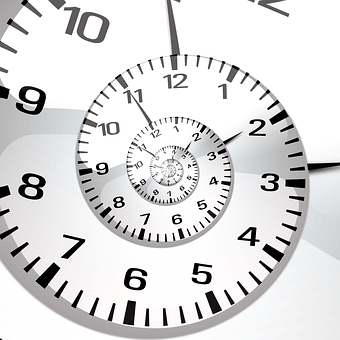
Time, Spiral, Droste, Clock, Hours  Over the weekend, I found a cool app for my ipad called Hyperdroste.  Droste is a  technique which causes smaller images to appear within the original one in a recursive pattern.

The name originated in Holland. Think of a picture repeated within itself.  It was named after the chocolate of the same name who first used the effect on a package of its cocoa.  The picture showed a nurse holding a tray with a box of Droste's cocoa and cup of cocoa which showed the nurse with a tray holding a box of Droste's cocoa and cup of cocoa, and one and on.

They were the first to use it but if you look around you'll find the effect on record covers, food advertisements, camera ads, etc.
The picture to the left is an example of the effect.  The effect is also seen in some of Escher's artwork.

The mathematics for this technique was finally worked out in 2003.  Several mathematicians at Leiden University used Escher's Print Gallery drawing to figure out the mathematics involved in this technique because Escher used it a lot.  The thing about the Print Gallery creation is that the center has a white space asking people to finish the pattern so these mathematicians did.

Escher apparently took square grids and transposed them onto a curved grid.  They discovered the basic technique is first stage uses a transformation of z to  log(z) for base e logarithm, the second uses rotation and scaling or rotation dilation, while the third stage uses exponentiation of z to e^z to create the spiral effects. After more checking, they concluded Escher used a scale factor of 18 and a 160 degree rotation for the second step.

It turns out he stumbled across a mathematical concept called Conformal Mapping which is an angle preserving transformation. This concept allows people to transform anything and still get a recognizable image.

Unfortunately, I cannot find any instructions for doing this by hand.  I did find a wonderful description of the mathematics used in this process at this site. There are numerous sites with tutorials for using Photoshop, Adobe, and other programs but there are a few sites online that provide free software for students to do this.  One is PhotoSpiralysis which works on iPads and allows students to play with images.

I played with this program on my Mac and here are two photos I created using the program.
 The first photo above is plain with the effect applied so you see pumpkins within pumpkins, within pumpkins.
The second photo, above, has taken the same photo and spiraled it so it looks more like a nebula.

Check around and you'll find other apps, programs, etc which you can have students use to create these.  As always, let me know what you think.

Friday, October 13, 2017

Sweets to Teach Statistics.

Valentine, Candy, Romance, Love, Sweet  In the past, I've used M&M's or Skittles to teach students about pie charts.  They've sorted the candy into each color before calculating the percent of each color in the package.  Once they had the information in fraction, decimal, and percent forms, they were ready to create pie charts, bar graphs and other methods of visualizing the information.

I am about 2 years behind in reading my NCTM magazines.  In the September 2016 issue of Mathematics teacher, a title involving tootsie pops and statistics caught my attention.

A quick search shows a variety of candy based activities designed to teach both probability or statistics.  The candy element creates interest especially if they know they will be able to eat the sweets when the lesson is completed.  I will share a few of the resources and links so you can explore the activities in more detail.

The Society For The Teaching of Psychology has a wonderful pdf filled with 9 activities and demonstrations designed to teach basic statistics and research methods.  These activities cover everything from population and samples to components of experiments, to central tendencies and probability.   Only one of the actual activities uses candies, number eight, but the others use music, dating, football, etc.

The eighth activity uses skittles to  help teach more about population, sampling, probabilities and includes vocabulary.  There are 5 questions asking them to calculate the probability for finding skittles that are not red, selecting three oranges from the bag and other situations.

How about having two bags of small bars of candy.  In the first bag you tell students there is a equal mix of Mars, Twix, and Snickers.  You tell students that if they can guess the candy you just drew out they get it.  What they don't know is that you placed only Mars bars in the bag.  After about 6 bars, see if the students have noticed things are not quite right.  This leads to a wonderful discussion of the probability of getting three in a row of the same candy if it has equal amounts of the three candy bars.

Then have them guess the candy you'll be pulling out of the second bag.  This bag is filled with an equal mix of Twix and Snickers with no Mars bars.  By now students are suspicious.  This activity gives you a chance to discuss null hypothesis, hypothesis testing, and inference.  The above activity came from the Learn and Teach Statistics blog.

From another Teach Psychology website, we have access to a power point presentation containing all the information to run the activity on Samples Representing The Population using M & M's.   This activity begins by having all the students take their bag of M & M's, sort them by color, and calculate the percentage each color represented in the bag. 

The students go around visiting with other students to write down their results and using all 6 samples to calculate the percent of each color over the larger sample.  Students are asked to compare the results of the small samples with the larger population and then explain if the percentages changed.   At the end, they compare their results with the official M & M percentages.  The point of this exercise is to show students the larger the population, the more accurate the results.

I'll cover the Tootsie Pop exercise next week.  Let me know what you think of these.
Have a great weekend.


Thursday, October 12, 2017

Math Magic

Magic, Magician, Hands, Conjure, Show  Have you ever thought about using the magic of mathematics to help students understand math better and to increase interest?  I hadn't until I read a couple of articles on it.

The mathematical tricks in math can be divided into three categories.

The first type are the ones which place an operation or two on an original number and end up with a given number.  An example is:
Think of a number between  1 and 100.
Multiply your number by 4
Add 12
Multiply this number by 2
Add 16
Divide the number by 8
Subtract your original number.
Your answer is 5.

The second type are those which recombine and rearrange digits. An example is:
Write a three digit number using three different digits.
Mix up the digits so you get a different three digit number.
Subtract the smaller number from the larger number.
Add the digits in the difference to get a one digit number.
Subtract 5 to get the final number.  The answer should be 4.

The third type is where the beginning number is the final number.  An example of this one is:
Write down the year of your birth
Double it.
Add 5
Multiply by 50
Add your age
Add 365
Subtract 615

Your answer should have 6 digits.  The first four are the year of your birth while the last two are your age.  I tried it and it worked beautifully.

The great thing about these tricks and others you can find on the internet and in books, is the fact they can be translated into algebraic equations for each step.  This provides a direct link between algebra and the way these tricks work.

Math magic can helps students learn more about expressions, variables, equal signs, functions, and seeing different types of equations are solved using different algorithms.  If you select the correct magic tricks you can use them to introduce function notation and inverse functions.

In case you wondered, yes, I tried it in all my math classes yesterday and it was absolutely successful.  If I had the stuff, I would have gone in with my magic hat, magic wand, and put on a real show.  The students were amazed at the results.  They laughed and payed attention. They were fully involved.  They want to do it again sometime.  

I got all these magic tricks from this issue of Education World.

Let me know what you think. I'd love to hear.  Have a good day.


Wednesday, October 11, 2017

Taxi Cab Geometry

Taxi, New York, Yellow Cab, Nyc, America  Taxi cab geometry does not look at the distance between two points as a straight line but the total sum of the absolute values of the differences of their coordinates.

In other words, if you look at the distance from Grand Central Station to the Empire State Building, you are not looking at the direct distance based on how far it is to fly.  You are looking at the distance based on having to work around the square blocks in town. 

The distance in taxi cab geometry is usually calculated by counting the number of blocks a cab has to travel to get from point A to point B.  Due to the fact, there may be multiple routes to follow, there may be several paths with the same distance.  The quickest way to find the minimum route is to apply the Pythagorean Theorem.

A circle in this branch of geometry often looks like a square even though it is defined as being made of four congruent segments with a slope of either 1 or -1.  In addition, the radius is still the same on both axis.  Hyperbolas and ellipses exist in taxicab geometry but they do not have the same curves we are used to.  Instead of curves, they are made up of line segments and diagonals yet they meet the standard mathematical definitions in Euclidean Geometry.

It turns out taxi cab geometry is a variety of non-Euclidian geometry formulated by Hermann Minkowski in the 19th century.  The idea is that distances are measured by adding horizontal and vertical distances rather than the direct "as the crow flies" distance.

If you'd like to introduce this topic to your geometry class, Jim Wilson has created a nice introduction using a variety of files for graphing calculators to help the student learn more about circles and analytic geometry.  Fortunately, there is an activity in Geogebra ready to be used by students as an introduction to the topic. The five files explore a different facet of Taxi Cab geometry.

In addition, Desmos has 1, 2, 3 different activities dealing with this topic. The third one compares Taxi Cab with Euclidean Geometry in a very visual way.

Let me know what your think.  I'd love to hear from you.


Tuesday, October 10, 2017

Zines in Math

Magazine, Photo Book, Brochure, Layout  I don't know about your school but at mine, we are working on integrating both reading and writing across the curriculum so I'm always looking for ways to do this in a variety of different ways. 

When my latest math magazine arrived the other day, it contained one on creating zines.

It used to be we had students make posters and pamphlets but now with technology, we can now produce books or magazines.

Not all students understand math is more than just solving problems to get the right answer.  In addition, too many students believe you either are good at it or you aren't. If you aren't, you won't be able to solve problems but what about engaging students in a different way.

The nice thing about zines is you don't have to use technology.  you can but you don't have too.  You can do it in the old fashioned way.  All you need is paper, colored pencils or pens, and time.  If each student created a monthly zine to take home and share what they've learned, you have automatic communication with parents.

So how do you go about producing a zine in your math class? 
1. Decide if each student is to produce one or are they allowed to collaborate.
2. Brainstorm topics based on recent topics taught in class.
3. Narrow the selection down to one topic.
4. Have students research places the topic is used in real life.
5. Create the blank zine out of paper.  This site shows how to make it out of paper.  This site shows how to create a sewn version.
 You can also take sheets of paper, fold them in half, staple, and you are done.
6.  Make it.
7.  You can make copies using the copy machine.

I have not found any apps to use to make anything other than covers but I did find two places on the web for creating digital magazines.  Neither appears to cost anything if you use the free packages.  I will give the URL's but I have not had a chance to explore their services yet.
1.  Lucid Press claims to offer some free services.
2. Madmag offers free web based magazines.

The zines can range from stories and expository writing to lists, to pen and ink drawings.  Allow the student freedom when creating zines so they can:
a. Use their strengths to share their mathematical experiences.
b. Know they have something to teach others about mathematics.
c. Reinforce the idea that mathematical abilities exist that are not always recognized in the mathematics class.

Zines provide a safe place to express idas because anything goes.  There are not hard and fast rules involved in the content of a zine.  This allows students who feel they are not very good academically to produce successfully. 

Although the focus is on mathematical topics, these zines already have a built in audience of the teacher, other students, and parents. So they already know their audience but their parents may not be as familiar with mathematical topics so students need to create articles so as to teach their parents or others.

Zines can also provide a chance for students to reflect on their learning in a way that is most comfortable for them.  It gives them a chance to connect the math with previous experiences, with life outside of the class, and to help them verbalize their understanding of the topic.

Producing a short zine shouldn't take more than 2 class periods so give it a thought.  It is a great way to integrate writing into the math classroom.

Let me know what you think.


Monday, October 9, 2017

Oreos and Math.

Cake, Pastry, Sweet, Sugar, Unhealthy The other day I popped into the store and the cookie aisle caught my attention.  I remember eating them as a child when I visited friends houses.  We always had cookies made from scratch at our house so having a store bought one was a huge treat.

So I went and looked up information on the cookies and found some really cool information, some of which is actually mathematical.

For instance, when students ask about ratios in real life, you can tell them that all oreos are made with a 71 percent cookie to 29 percent filling ratio.  In addition the double stuff does not have double the stuffing.  A math class in New York checked it out and discovered the filling is only 1.86 times more. The mega stuff oreo advertised they had triple the filling but in reality it was only 2.68 times.

Now back to the cookie filling ratio.  The company makes 123,000 tons of creme every year to fill those cookies.  Let the students figure how how many tons of cookies are made.

More than 500 billion cookies have been sold since 1912.   To get an idea of that number, if you lined the cookies up end to end, the line would go around the earth at least 312 times.  The circumference of the earth is just over 24,900 miles.  Let the students figure out how many miles that is.

In addition, if you stack that same number of cookies one on top of the other, the stack can go from the earth to the moon and back 8 times.  The distance is 238,900 miles between the earth to the moon.  Let them figure out the distance 8 times represents. 

The creation of one oreo from start to finish takes 59 minutes.  Every cookie bakes for exactly 290.6 seconds.  Let students figure out what percent of the 59 minutes that is.

Another interesting fact is that in 2011 - 35 billion cookies sold in one year, 10 billion were sold in the United States alone.   The rest were sold to the other 99 counties who sell it.  So on average, how many were sold in these countries.

Lots of nice real world math provide by the history and current facts for Oreo cookies.

Let me know what you think.

Friday, October 6, 2017

Finding Modeling Problems

Homework, School, Problem, Number, Paper  As part of the information from yesterday's column, I discovered two contest sites and one site with information on how to create a model to work the problem.

One of the universities in California created this wonderful slide show "Using Mathematics to Create Real World Problems." to show students the process step by step.

It begins with the steps from the word problem to the finish before going through the problem step by step so students see how the modeling works.  I know very little about modeling because I got a degree in theoretical mathematics in college and none of the classes I took ever delved into this topic. 

In order to teach modeling, I need this slide show to teach myself before I teach the students. The material is clear, easy to follow and ready to use.

The Consortium for Mathematics and Its Applications runs a yearly mathematical modeling contest filled with past problems you can use in your classroom.  The problem I looked at involved a standard bathtub you fill with water and needing to keep a small stream of hot water added into it to keep it warm.  The student is to create a model to show temperature changes as water is added, etc.

As far as I can tell, they do not post the actual solution but they do have problems dating back to the 1980's  There is a link to the Math model site which has some problems and articles focused on mathematical modeling.  It also provides problems for high school and undergraduate levels.

Another web site is the Math Modeling Challenge who offer modeling problems in a contest format.  This looks like it is made for high school students because the problems see a bit more broken down.  They provide regular practice problems for anyone to use.  This site offers some great resources from a free handbook on mathematical modeling to a teaching modeling video series. 

One last thing in regard to real modeling problems.  If you can remove the context and still solve the problems, then they are contrived problems that are not real modeling problems.  This is an important point since we want students to experience the real thing.

I'll be back in the next couple weeks with places to find mathematical modeling problems one can use in the classroom that are real but good to introduce students to the concept.  There will be messy answers so students get used to not having perfect answers.

Let me know what you think.  Have a great day.

Thursday, October 5, 2017

Math and the Future.

Classroom, Math, Chalkboard, School  The other night, I ran across an online article from the American Scientist in which the author gave 5 reasons for mathematical modeling being taught in school.

Her reasons are sound.  She did not make any new points, only those who want to change how math is taught have made before. 

It is good seeing this topic addressed in a place outside of mathematics because the word needs to get out.

In addition, she eloquently discusses how mathematical modeling is often used to create a good enough answer for a mess real world problem.  I like that she talks about a "good enough" answer, rather than a perfect one.

The first reason the author gave for teaching mathematical modeling is that modeling offers the students a chance to make genuine choices rather than performing the math by rote.  Unfortunately, standardized tests are set up to have nice, easily graded problems rather than messy real life problems.  Students must make choices in regard to the parameters used, the math needed, and determine if the solution is reasonable before communicating their findings.

Second, most real modeling problems have multiple solutions rather than just one so everyone stands a good chance of being "right".  Solutions to mathematical modeled problems must use valid mathematical arguments and make contextual sense.  Many times solutions are approximations rather than precise answers depending on the complexity of the problem.

Third, many of the "real world" problems presented in textbooks are not very interesting and certainly not practiced that way in business, economics, or other fields.  Mathematical modeling problems are practical and answer a question someone needs in order to make a decision.  One example is when companies are testing new drugs, they need to know the point at which it can be released safely to the public.

Fourth, there is an idea in school that you must learn a certain amount of material within a specific time period.  In reality, mathematical modeling problems may take a longer period of time to find the answer.  They also allow students to use the tools they want while practicing skills they need reinforced.  There is not an easy solution because the process of modelling requires a person to try, adjust, and try again until a solution is found.

Last, modeling shows students that mathematics can be a team sport rather than having to work in solitude.  In real life, teams are used to solve problems when modelling.  Collaboration allows communication and a solution to be found faster than working alone.

The thing about modelling problems is you can find them all around you. One example might be rating the food in the cafeteria using a list of criteria so the student knows what the most and least important characteristics in order to determine the best food.

These are all valid points.  Tomorrow, I'm going to provide several websites with modeling problems.  Some of the problems will be not bad while others will require quite a bit of work.

Let me know what you think.  Have a great day.


Wednesday, October 4, 2017

Super M.

Fish, Tropical Fish, Sea, Exotic Fish  While looking for more technology based optimization problems, I came across a website, SuperM,  based in Hawaii with some really great problems.  I admit, they are geared towards Hawaiian students but they are an interesting and provide a different perspective.

The site is filled with lessons from elementary up to high school and beyond. Each lesson has information on the activity, the type of math involved in the lesson and the grades its appropriate for.

I checked out several including one on aquaculture.  The activity covers algebra, population modeling, exponential and logistic equations, graphing, and equation solving for grades 9 to 12. The lesson looks at managing fish populations with a focus on Hanauma Bay. 

Hanauma Bay is a beautiful place filled with clear water and pristine white sands now under the control of the state of Hawaii to protect it.  Its easy to find pictures of the place.  There is a lovely page giving background information, equations, graphs, and includes answers.

There is another on invasive species in Hawaii.  I know Fairbanks in Alaska is suffering from invasive species of plants because every parade a local group marches educating people about those.  This activity covers the same mathematics as the aquaculture.

This activity focuses on a type of frog accidentally introduced in 1988 from Puerto Rico.  In the 30 years since its introduction, the frogs have really multiplied and spread out all over the islands.  The activity looks at population growth both in Hawaii and on another island in the Marine sanctuary. 

Both activities take students through the process step by step from setting up the situation to doing the math including the actual equations, to making conclusions based on the data.

Although these are designed as paper and pencil activities, it wouldn't take much to convert them to be used with technology.  Instead of tables and graphs, it is easy to use spreadsheets and graphing functions.  Students can also put their work and conclusions on a slide for a presentation or a book or a magazine. 


Some activities begin with an experiment rather than a situation.  The hands-on activities are much like a science experiment where students have to write down data, formulate and write down conclusions. 

Even though it is Hawaiian based, it exposes students to other cultures and introduces a bit more diversity into your math program.  Check the site out and have fun.

Let me now what you think.  I'd love to hear.


Tuesday, October 3, 2017

Mathmatical Modeling with My Maps.

Hands, World, Map, Global, Earth, Globe  I have started going through my old issues of Mathematics Teacher and the middle school one for ideas and interesting activities.

 I try to use suggestion from Cartoon Corner, Mathematical Lens and Real world problems but I seldom take time to read the full length article.

I came across one on mathematical modeling using the MyMaps app and spread sheets.  The idea behind this activity is to provide students with experience using programs anyone can use because many programs used in schools are not always available outside of schools.

This activity also teaches students some of the lesser known functions of MyMap because these functions help teach optimization.  One of the functions the app offers is the ability to import data from a spreadsheet.  Data used to build a user specific map.

Since MyMap shows real time traffic data, each classes results will be different allowing them to understand the real world does not always provide static answers. This reinforces there is no one right answer.

The MyMap app has a tool that measures linear distance between two points.  The app allows students to add points of interest, airports, and other important locations.  Once all the important landmarks are placed on the map, its time for the task.

The task, designed to use with this app, is to use a fully prepared map to plot delivery routes for a truck and a drone to determine which method is optimal for time and cost.   Various companies are exploring the use of drones for delivering medicines, food, and other small objects but they have rules and regulations concerning where they are able to fly, where as trucks are limited to roads.

Since each delivery location is marked by a pin, students can rearrange the pins to create the optimal delivery routes. Once both truck and drone routes are completed, it is time to put the information into a spreadsheet to keep track of distance, time, and cost for each delivery.

It is best to supply students with client information already entered to save time and insure accuracy.  Client information should include name, address, number and weights of packages to be delivered and whether the location is a business or residence. 

On a different page, students are required to keep track of distances, amount of time deliveries took, and a column to determine the cost of deliveries.  Once all the data is entered and students have concluded which routing is better, it is time for them to write a conclusion with explanation for which items should be sent via which method and why.

This is a great activity but its not one I can easily use out here because we don't have much in the way of roads or non restricted air space.  I'd have to have them plan it for Anchorage which is more realistic and many students have been there.

I like the idea so I just have to make a few adjustments, install a couple of apps and then I can do it.  If you are interested in reading the full article, check out the September 2016 issue of Mathematics Teacher for more information.

Let me know what you think.  I love hearing from people.


Monday, October 2, 2017

Technology in Schools

Macbook, Apple, Imac, Computer, Screen  Today's entry is being written in response to a comment made on Twitter in response to another comment.  When you ask someone if they are joking about the use of what they see as an out dated piece of equipment, it shows a person who is out of the loop.

People often forget not all schools have the same amount of technology available.  Not all schools have enough computers or iPads for a 1:1 school.

My school used to but recently, we haven't had the money to update any of our equipment so its getting old.  We don't have enough computers or iPads for every student.  In addition, many are 5 to 6 years old.  We do have internet but the bandwidth is not enough to have more than 45 students on at the same time. At that point, students get kicked off or internet falls to a very slow drizzle so its hard to use.

Most classrooms have a smart board but about half are attached to the wall including mine. At this point it is too much trouble to have it removed because I only use mine for projecting web based jeopardy games.  I don't have time to create everything from scratch.  My students enjoy playing a mathematical version of jeopardy.

In addition, I often take already created presentations and cannibalize them for what I need out of them to use in google classroom or in nearpod.  I try to create assignments which allow students to become more independent.

I am lucky, I have a classroom set of iPads but I have to share them with other teachers in my wing.  I've been lucky to have them as many of the teacher only have the Smart Board in their classroom.

In addition, too many of my students do not have access to internet at home.  Internet out here is so much more expensive than anywhere else.  In town you can get one TB for $175 per month, here its $160 for 40 GB.  That is a big difference.  Even internet access via cell phones can be so expensive.

The teachers do the best they can with the limited technology.  The technology department  has placed the available computers on carts so teachers can check them out.  Teachers may sign up to use the computers in the library and computer room but again, due to the age, there are certain programs we can't update.

We all know what equipment and programs we should have but without an influx of monies, we can't get what we need, so we make do.

Just a plea to everyone out there.  Before you ask if someone is joking, stop and remember people may not have access to the same equipment your child's school has.  I am aware of places out there I can request equipment but some districts have a rule that if you obtain anything that way, it belongs to the school.

Let me know what you think.