Wednesday, February 28, 2018

Roman Numerals + No Zero

Clock Timepiece Perspective Clock Face HouYesterday, when I read that Roman Numerals had no zero, I wondered why?  It doesn't seem right that a culture who did so much for the world would not have that one concept. 

There are a couple of reasons including the fact that Roman Numerals were not used for arithmetic so they didn't need a zero.  Instead they used an abacus or counting frame to carry out addition or subtraction.  An empty space played the part of zero.

In addition, it is said the Romans developed their numerals as an easy way of pricing goods and services but not for adding or subtracting as noted before.  One reason they use IV instead of IIII for four is that Romans do not like seeing four of the same numerals appearing in a row so they created the concept of subtraction since IV means one less than five.  If the numeral appears after as in VI it indicates addition or five plus one more is six.  But note, this addition and subtraction concept only applied to creating numbers, not to doing arithmetic.

It is said that Roman Numerals composed of combinations of the seven letters of I, V, X, L, C, D, and M sometime between 900 and 800 BC.  Each of these letters refers to hands and counting such as the I represents one finger, the V is the shape between the thumb and forefinger and represents 5.  The X is two V's and represents two hands and so on. 

Although the Greeks understood the concept of zero meaning nothing they didn't think of it as a number.  It wasn't until about 1500 years ago in India that the number zero made its appearance as a dot but over time, it expanded to the 0 that we know today.  The Arabs stumbled across it in the 8th century and were responsible for spreading it around Europe.

Zero itself was not well received because it was considered suspect because it came from Arabs.  In 1259, a law was passed which prohibited bankers from using zero or any other numerals introduced by the Arabs but eventually these new numbers joined the others to create the numerical system we know today which includes zero.

Let me know what you think.  I'd love to hear. 


Tuesday, February 27, 2018

12 Interesting Mathematical Facts.

Paper, Composition, Business, Writing  Today for something different, I'm going to share a few interesting mathematical facts just for the fun of it.  Ones that could make life a bit more interesting for students.

1.  If there are 23 people in the room, there is a 50 percent chance that at least two people will share the same birthday.

2.  If you shuffle a new deck of cards seven times, you have created maximum "randomness" of the deck.

3. The decimal equivalences of fractions with seven as the denominator produce the same six repeating digits in a slightly different order.  They do not use 3, 6, or 9 in any of the decimal equivalents.
1/7 = .142857142857
2/7 = .285714285714
3/7 = .428571428571
4/7 = .571428571428
5/7 = .714285714257
6/7 = .857142857142

4. 26 is the only number between a perfect cube (3^3) and a perfect square (5^2)

5. Although you can fold paper more than 7 times, it usually requires either toilet paper or special heavy equipment that will press it flat, in general its hard to fold more than 6 times without extra help.  If you could fold the paper as 104 times, the thickness would be 93 billion light years.

6. Hundred is said to come from the Norse word Hundrath which  means 120 not the 100 we use it for.

7. if you multiply 111,111,111 by 111,111, 111 you get 12,345,678,987,654,321.

8. William Shakespeare used the word Mathematics in his wonderful play "The Taming of the Shrew".

9. Zero does not exist in Roman Numerals. 

10. The addition (+) and subtraction (-) signs were used as early as 1489 AD.

11. A jiffy is actually 1/100th of a second.

12. 10! seconds is equal to exactly 6 weeks.

I was feeling a bit silly today so decided to look for some interesting mathematical facts to share with everyone.  Have a good day and let me know what you think. 


Monday, February 26, 2018

The Math of Olympic Figure Skating

Sarah Hecken Skater Rink Figure Lady Girl  Growing up in Hawaii, I never got the hang of how they score figure skating.  I learned to ooohhh when the announcers said to and I groaned when they did but I never actually learned much about it.  I actually did my first ice skating in Tucson Arizona at the combination bowling alley and skating rink.  I managed to stay up but my mother fell, dislocating her shoulder. 

So how do they score the ice skaters who perform at the Olympics.  Its more complex than I ever anticipated especially as they changed the system after a scandal in 2002.  Prior to this they used a scoring system based on a 6.0 being perfect but now, its way different. Are you ready for it?  I am.

The first step in scoring ice skaters is when the judges look for six moves, the Axle, flip, loop, Lutz, Salchow, and the toe loop that must be in every performance.  These jumps are looked at for technical and for overall performance and skaters receive two scores, one for each.

The technical award is done by two groups of people.  One is a nine judge panel who look at the quality of execution while the other is a five judge panel who looks specifically at the technical aspects of each jump.   Every move has a predetermined score such as the triple axle is worth 8.5 points for its base.

 If you perform a move with a higher difficulty rating, you get more points.  Sometimes just attempting a more difficult move, even if you don't make it, will give a higher score than performing a simpler one.  Furthermore, it is possible to get extra points by performing certain moves during the second half of the program when an athlete is more tired.

In addition, the nine member panel, they give a grade of execution from -3 to + 3 for every move.  This number is added to a predetermined base score for the move, but the highest and lowest scores are dropped so the average of the remaining seven scores makes up the technical score.

Furthermore, judges can award 1/4th to 10 points based on the five different components of skating skills, transitions, performance, composition, and interpretation.  The judges scores are averaged and then multiplied by 1.6 for the long program or .8 for the short program.  Finally, there is a referee who monitors the whole process

That is how they come up with the scores for ice skating at the Olympics.

Friday, February 23, 2018

Brain Pop

Nerve Cell Neuron Brain Neurons Nervous Sy  While at the Alaska State Technology in Education conference I attended two different sessions presented by Brainpop.  Most of us know them as the people who produce those movies with the quizzes you can show your kids.  The movies star a cartoon young man and his robot.  The idea for most teachers is that you show the movie before giving the quiz to your students.

There are three versions most people are concerned with.  BrainPOP,  BrainPOP jr (k-3) and BrainPOPELL but I am looking at only at BrainPOP for this entry because I'm a high school teacher.  The first session highlighted the huge number of games offered so you can increase the gamification of your classroom while the other session was designed to discuss BrainPOP certification.

Through each session, I learned more about the extensive material offered by this site.  In addition to movies and quizzes, students can use the movies to create a graphic organizer of the material. They are even allowed to insert portions of the movie into the organizer.  As we know, research indicates that it is good for students to create graphic organizers as a way of helping them understand and learn the material.

Students can also make their own movie where they can answer a preset letter or a letter of their own on the topic.  They have everything they need to create the answer, just like the movies provided by BrainPOP.  Now the fun part starts here in that there are usually games associated with the topic and most are now HTML5 which means they will work on iPads.

I played a game or two and enjoyed them.  One game required me to find the value of colored money while the other was a time line of the American Revolution.  Since I teach math, the timeline one required a lot more work.  As I got close to the end of one set of questions, it asked me what the next topic would be.  It was challenging.

Add to that the NewsElA articles integrated into lesson.  NewsELA has articles at different reading lexiles and includes a quick quiz at the end.  There are some FYI which talk about the material in detail and might have a comic, activities and for a few topics, BrainPOP includes a primary source on the topic.

I've never seen primary sources applied to mathematical topics.  This is cool because it teaches students to interpret the data and shows them that there are primary sources out there we can use in mathematics.

They have an educator section with everything you need to integrate this into your classroom including lesson plans.  The other day I wrote about issues we have at school with our internet.  My frustration came out of wanting to use BrainPOP in my classroom but running into bandwidth issues which make it less likely I can use it.  I'm going to try but I can only hope.

Let me know what you think.  I'd love to hear. I  didn't publish yesterday because I was stuck in Bethel with limited internet so couldn't access my blogging account.  Have a good day.


Tuesday, February 20, 2018

Personality Types and Classroom Management? Yes or No?

People, Group, Many, Child, Education  I am at a Technology in Education conference.  I have been to several sessions but today I went to one on how knowing their personality type can help you with classroom management. 

The session began by having all attendees take a personality test by Tony Robbins.  When done, you'd get the results of your test and honestly the test for me was ridiculous because it had me put in order statements. 

The statements were short and half of the I did not relate to so I just did anything.  We were told we needed to take this personality test so we'd understand the explanations better.  Baloney.  I didn't need that since all that really happened was the presenter showed video clips from movies on each personality type.  This one used dominance, inducement, compliance, and submission.

I was waiting for him to discuss how to use this information to help with classroom management but when he never discussed it.  What it mostly came down to was as a teacher I should look at my personality type and see how it interacts with the kids personality.  Yuck.  I got nothing out of it.

As far as I can tell, there is no real research done on this topic. There appears to be no reputable connection between these personality types and classroom management.  I did find that these personality test is used more in business than education.  Any information, I found on this topic used a different set of labels but these tended to divide people into either  extrovert or introvert, sensing vs intuition, thinking vs feeling, or judgement vs perception. 

With the introverts vs extroverts, it is said the introverts prefer to work alone and they like to take time to think before answering questions while extroverts do better in groups and love to talk out loud.  Sensing focus on concrete details while intuition learners like to focus on the big picture.  Thinkers apply their knowledge as they want to without regard for the specific situation while feeling students like the rules especially if the rules take thier motivations into account.  Finally, perceiving students like to keep deadlines flexible while judging students like solid deadlines.

Each one of these is associated with a preferred cognitive style, studying style, and instructional style based on which one they are.  The bottom line is that the two don't seem to related for education.  I think that students have aspects of all the personality types.

All I can say is that the presentation did not meet my expectations and I found it was a waste of my time.  I'd love to hear your thoughts on this topic.  Let me know.


Monday, February 19, 2018

The Hidden Costs of The Olympics

Skates Figure Skating Artificial Ice Ice R  Back in 2012, a group in the United Kingdom looked at the hidden costs of the Olympics.  What constitutes a hidden cost?

Some of the questions include concepts like does the host nation have an advantage when it comes to winning medals?

Are certain records be more likely to broken in certain locations or how does the geometry of the Valedome contribute to speed.

Well the Sports Maths site from 2012, has some great exercises to help students from kindergarten up to high school seniors to  learn more about the hidden costs of the Olympics.  For older students, they figure out how to design a stadium so that no matter where they sit, they can see any event.

Several activities has them analyzing to answer a variety of questions from weight and the shot put, balance and sports, etc.  Some activities offer students a chance to perform mathematical modeling in real situations.  Admitted these activities look more at the summer Olympics but it still provides some wonderful real life activities for analyzes.

Another activity created by Simon Frazier University. has a presentation that looks at the mathematics of running including track geometry and dynamic models for running while looking at the bias in medal giving.  I like the detail in it.  It addresses the question of a loud gun versus a quiet starting pistol, staggered starts, weighted Olympic counts.  This is very detailed math wise.

Math up the Olympics suggests students convert metric to standard English measurements so students know how much 10 meter high dives, or a 4 by 400 race.  Discuss the differences between first and second places.  I was watching some races the other night where they regularly posted  a positive or negative time to give viewers the chance to see how close they were to the winning score.

Although this is from the 2014 Olympics, it can be adjusted for the 2018 Olympics because much of the basic information is the same.  There is a lovely article that looks at the speed of snowboarder and slope style, etc.  Its called defying gravity. It even explores Curling by using physics. This site even explores the need to make snow for halfpipers etc.

Enough sites with material to put together a nice unit on the mathematics of the Olymics.
Let me know what you think.  I'd love to hear.


Friday, February 16, 2018

Connecting Algebra to Geometry

Mathematics, Formula, Physics, School It's interesting that for the most part, Algebra and Geometry are taught as two different classes so students often have difficulty seeing any connection, even when algebraic expressions are used instead of degrees.

One connection is that any two dimensional shape can be represented on a coordinate system via one or more equations and intersection points.  Actually any graph is a geometric representation of the algebraic statement.

Furthermore, the area and perimeter of any two dimensional shape can be expressed in an algebraic equations such as the area of a parallelogram is always A = length x width.  While three dimensional shapes such as Surface area, and Volume have their own equations.  These algebraic equations represent the physical found in geometry.

In addition, the Pythagorean Theorem provides an algebraic method of finding the length of missing sides for triangles and can be used to determine the type of triangle without needing to draw each triangle.  So if a student is given sides, they can use the theorem to determine if it is an acute, right, or obtuse triangle.  One activity I do in class is have students classify triangles using the Pythagorean Theorem and then have students draw the actual triangles using the given lengths to confirm their algebraic answers.

We also have algebraic equations based on the number of triangles in a polygon so we can find the number of sides, each interior angle, or the measurement of each exterior angle.  The formula can found simply by looking at the patterns of the number of triangles within a quadrilateral on up to a heptagon or further. 

We see transformations all the time in both geometry and algebra.  We see the transformations via certain additions to the parent equation such as y = x -3 indicates the line crosses the y axis through (0,-3) instead of  (0,0).  We can see transformations listed algebraically via h and k while they are quite visible if drawn.  There are other clues indicating a shape has been flipped or dilated.  All of these transformations can be represented by algebraic equations or visually through geometry.

I think its important to stress the relationship between the two topics so students learn there is a connection between the two and that they are closely related.  We can use technology in the form of GeoGebra or Desmos depending on what is needed.  Rather than teach them as we normally teach to subjects, we need to stress the connections, stress that algebra provides the mathematical representation of geometric figures.

Let me know what you think.  I'd love to hear.


Thursday, February 15, 2018

The Learning Pyramid

Pyramid, Desert, Camel, Pharaonic, Sand  The other day, I stumbled across something referred to as the "Learning Pyramid" was either developed in the 1940's and was based on Edger Dale's cone of Learning or it was introduced by the Learning National Training Lab in the 60's.  Supposedly it show the best ways people can use to retain information. 

Edger Jones, an expert on audio visual learning, wrote a book on using audio visual methods in teaching.  His cone of experience focused on the abstractness of the idea via various methods of presentation.  Apparently, he argued that teachers should use the different methods rather than talking about retention.

The original cone of learning did not have percentages but those were added later perhaps by someone who wanted to turn it into the "magic bullet." The first paper citing percentages came out in 1967, almost 20 years after Dale's publication.   Supposedly the National Learning Lab researched each instructional method and found the pyramid to be accurate but all related data disappeared and is not available.

The idea is that you are more likely to retain 90 percent of the material if you immediately teach it to someone one else whereas you only retain 75 percent if all you do is practice it.  The percents decrease if you only talk about it, watch a demonstration, listening, reading, or lecturing in that order.

It sounds good but is it accurate.  Has research over the past 40 to 60 years supported or disproved it. I admit, it sounds quite good but its origin is attributed to a couple of different authors.  The basic idea is the more active the learning is, the better retention but is it true?  Are the percentages even right?

Although it is still swirling around and is found on many web sites, there appears to be no scientific evidence to support this particular idea.  According to a study done in 2013, the content, the individuals age, the time between learning and retrieving the information, and other factors.  Furthermore, another study indicated that all methods resulted in retention but none were more effective than another based on the material being learned and the context in which it is learned.

It has been pointed out that reading is a valid method of learning especially for "Life Long Learners".  Furthermore, reading has been proven to be an effective method of instruction, especially when combined with direct instruction.  It has also been suggested that no real research ever comes out with such neat and tidy percentages that are multiples of 10.  Is the claim that a learner can retain 90 percent of what they've learned be real?

From what I've been able to find, the best method is to use the different methods listed as appropriate to the material, the students, and the way the different instructional techniques are used.  Add into that interleaving and retrieving information and retention goes up.

Let me know what you think.  I'd love to hear.

Side Note:  I will be presenting and attending the Alaska State Technology in Education Conference this weekend till Wednesday when I return home.  I hope to share some of the new things I learn with you over the next couple of weeks. 

Wednesday, February 14, 2018

Online Calculators and Apps

Calculator, The Hand, Calculate, Count  It finally happened in my class.  One of my students used an online calculator to factor trinomials with a leading coefficient of one.  It was easy to tell she'd done it.

First, she usually struggles with signs and tends to get them wrong so when she turned in the work in less than 30 minutes with only the answers and all the answers were correct, I knew she'd done something.

Rather than accuse her of anything, I gave her a quiz a couple days later.  She failed it miserably so I made a comment in passing that I asked them to show work so I could see her thinking and determine where she still needed help and when she goes online to find answers, it means she doesn't get a chance to learn the process. She just grinned and did all the problems again but this time included the work and made the same errors she's made in the past when working with integers.

As you know there are more and more tools on the internet or as apps which either give the answer to problems or provide the steps. Some of the apps are beginning to include written information for each step. I used one of the apps to solve 2x + 1 = 8

If you look at the above screen, it shows the steps with writing explanations for each step.  This makes it possible for students to write down each step with explanations but if the teacher requires complete sentences, students have to add sentences because most of use will not accept 1-1=0 as a complete sentences.

Still this is a step in the right direction as long as students actually read the steps, they can learn from this type of app.  The one I used is called snap chat.  It does read hand written equations so one can write it on a paper, snap, and voila but the app requires an internet connection to use.  That is only a problem if you do not have internet or its not reliable. 

Let me know what you think.  I'd love to hear.

Tuesday, February 13, 2018

Tangrams and Fractions


Chinese, Game, Shapes, Puzzle, Tangram  Being the only high school math teacher, the secretaries put all the catalogues with math things in my box.  Usually I throw them away without looking in them but the other day, I decided to check out the books just because I'm looking for new ideas.

I came across a book on using Tangrams to teach fractions.  That sparked my curiosity because I've used them to teach geometry concepts of convex and concave but never for fractions.

One way to use Tangrams to teach fractions is to have students make their own out of the stiffer construction paper.  Students use a 6 by 6 inch piece to create the set.  They start by folding the paper in half from corner to corner and then cut along the line so they now have two triangles.  Take one triangle and fold it again in half to make two smaller trangles so you have two like the tan and light blue ones.

The student then takes the point of the other triangle and fold it to the midpoint of the longest side.  Cut off the triangular piece at the top so you are left with an isosceles trapezoid.  This triangle is the green one. Fold it in half so you have a right trapezoid shape before unfolding.  Then take the corner on the longer side and fold it to the middle on the longer side before unfolding it.  Then fold the opposite short corner on the other side of the middle fold to the midpoint opposite.  Then unfold it.  You should see two smaller triangles such as the darker blue and yellow ones on each side of a square and the parallelogram.  Cut the shapes and there are the seven pieces of the Tangram.

Each of the two large triangles represent one fourth of the total shape.  The parallelogram, square and mid-sized triangle represent one eight each of the total shape.  The two smallest triangles each represent one sixteenth of the square.  If these directions do not make sense, check out this site with the directions and worksheets.


If you check out page one of this pdf, you'll see it assigns values of one to various shapes in the Tangram so students are looking at fractions greater than one.  In addition, this pdf has students taking their learning and applying it to several nontraditional Tangrams to determine the fraction of each shape.  It makes a nice extension activity requiring transference of knowledge.

If you wonder why I'm addressing the topic of fractions in a blog that looks at topics for middle school and high school, I have students who arrive in 9th grade who do not have a firm foundation in fractions and struggle.  The above topic gives them a different perspective to fractions and might be the one item they need to help them understand the topic.

If you need to you can extend this topic by having students change the fractions into decimals and percents if you need to work on showing the relationship between the three.

Let me know what you think, I'd love to hear. Have a great day.

Monday, February 12, 2018

Alpine Skiing and Slopes

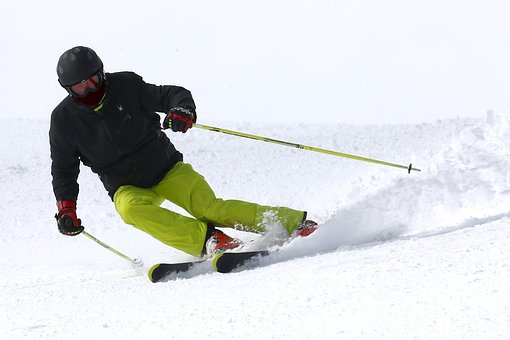
Ski, Skiing, Sport, Alpine, Race, Winter The Olympics has started, the first competitors are fighting to bring home a medal for their country and I learned something new about Alpine Skiing or downhill skiing.   If you checked out the two warmups from this past weekend, you might have learned something new.

In Alpine Skiing, ski trails are not measured by degree as many other slopes are, but are labeled in  slope percents or gradients.  The sport chose the 45 degree slope as base because the length and height is the some so when you take the change in Y divided by the change in X you get 1 or 100 percent.
 
In the United States, ski trails are rated according to one of four symbols ranging from green or the easiest to the double black diamonds indicating the most expert trails.  These break down in the following manner:

1.  Green circles indicate the trail goes down one of the  flatter slopes in the 6 to 25 percent range.

2. Blue squares represent intermediate slopes in the 25 to 40 percent range.  These trails are the most numerous and heavily used at all resorts.

3. A single or double black diamond represents a slope in the 40 and above range.

Think about this, the normal stairs that are 7 inches high and 11 inches long have an angle of 32.5 degrees but a percent slope of 63.9% which would make it an advanced slope.   The thing about Alpine skiing is that the classification of the trail is not only decided by the slope.  It takes other factors into account such as type of snow, distance and width of the trail, and bumpiness of the trail.

A trail with a percent of slope 35 percent may be considered an intermediate slope until you take into account the fact it is only 45 feet wide instead of the normal 100 to 150 feet.  It takes more skill to stay in control with the narrower track so it might be labeled advanced.

Alpine skiing is the general type of skiing done at most ski resorts.  Its the type I tried once but kind of gave up when I went down the hill backwards until I ran butt first into a tree.
 and other things.  I was also intimidated by 6 year olds who flew down the advanced track like it was nothing.

Let me know what you think.  Have a great day.


Friday, February 9, 2018

Laughter and Learning

Children, Latino, Beautiful, Innocence  The other day, I came across a title about laughter and math.   We know laughter can help a person stay healthier but can it help a person learn better?  This is one of those topics that no one ever talked about during teacher training so it sparked my curiosity.

According to the American Psychological Association, laughter can indeed help a person learn.  There is growing evidence that comedy when used appropriately, can improve student ability because it cuts down on anxiety, increases motivation and participation.

It appears that people are more likely to remember material if the professor sprinkles relevant jokes through the lecture.  In addition, well done humor inserted in recorded or digital material can motivate students into checking it regularly.

It appears that humor helps to relieve stress.  Furthermore, laughter itself can cause the body to decrease its production of specific stress hormones.  One way to help students relax during tests is to insert humorous directions or items designed to relax students so they feel less stressed. 

Another effect is that students believe they learn more from a professor who uses humor. They also feel that a professor who uses humor communicates better and are more responsive to student questions.  The things about incorporating humor into the classroom is that it has to be done so it does not distract the learning process. 

When integrating humor into the classroom, it is important to focus on learning first.  Remember, the humor is must be created with the student in mind.  It should not be overdone otherwise students look forward to the next gag, rather than focusing on the material being presented.

Furthermore, students who laugh in the classroom tend to develop good communication skills and improved critical thinking skills and creativity while deceasing the amount of stress they feel.  If they laugh in groups, their ability to work in groups improves their comradery, and helps develop a strong bond with others.

Research has shown that humor activates the brains dopamine system. The dopamine is important for the brains long term memory.  In addition, humor as stated earlier, does improve retention for students of all ages as long as it directly applies to the topic, otherwise it is not effective.

I admit, its hard for me to come up with humor for my math classes because most of us do not go around telling mathematical jokes to each other.  Never fear, a short look at the internet indicates there are quite a few sites with mathematical jokes starting with Readers Digest.  The very first joke I read there dealt with the ratio of pi and a pumpkin.  It made me grin.

You can put in simple searches such as jokes about algebra or jokes about trig so you can find some topic specific jokes.  Have fun with it and enjoy entertaining your students. Let them know you have a sense of humor.

Let me know what you think, I'd love to hear.

Thursday, February 8, 2018

Reading To Make Meaning.

Bear, Teddybear, Toy, Cuddly Toy, Teddy  I am working my way through "The Writing on the Classroom Wall" by Steve Wyborney.  I'm presenting each big idea to my students to help add a depth to their learning.  This week the idea is that reading is about making meaning.  That is  a powerful idea because we teach students to "read" the text but not to read for meaning.

Honestly, its not something I've ever thought about because most of the classes I've taken do not discuss the reader of a math text book should make meaning.

So how does a mathematics teacher help students learn to make meaning as they read?  There are several things they can do to help students learn to do it in math.

1.  Identify a short passage for students to read from the text, find a graph or data chart, or word problems.

2. Create a list of statements about the text that could be true or false, or could be open ended so as to generate discussion.

3. Introduce the topic of the text and have students read the statements before they read the text.  Ask them what they know about the topic before they read so they are activating prior knowledge and are able to predict possible answers to the statements.  See if they can make connections such as math to math, math to self, and math to the world.

4. As students read the text, they should write down support for and against each statement.  The support needs to be very specific so as to help develop their understanding of the material. 

5. Put students in pairs or small groups to discuss the evidence so they can read a consensus of whether the statements are supported or refuted.

6.  Conduct a whole class discussion to share their conclusions.  This gives students a chance to clarify their thinking or perhaps see something they missed earlier.

7. Use their conclusions to evaluate their understanding of the text.

These are the main steps in order to teach students to make meaning for any subject be it reading, science, math, or social studies.  If the middle school or high school teachers require students to follow the same process, it makes it easier for them to transfer it from one to the other.

Let me know what you think.  I'd love to hear.


Wednesday, February 7, 2018

Ways to Improve Student Understanding of Math.

Learn, School, Nursery School  One thing I've discovered when working with English Language Learners is that I have to do more than just teach the topic.  I have to help build their vocabulary because math has its own use of words and its like learning a foreign language.

But I also have to find ways I can easily implement in class to improve my teaching so their understanding of math improves.

There are 6 things a teacher can implement easily to help improve student understanding.  First, it is important to create an effective opener in which students are given the objective of the lesson or an "I can" statement.  It should also include expectations and an agenda.  It could also include one or more problems to review or access prior knowledge.

Second, when presenting the material, present it using multiple representations to address the various ways most students are comfortable being exposed to it.  These could include manipulatives, drawing a picture, drawing out the problem itself, or providing a symbolic relationship.  If students are exposed to and can recognize the relationship shown in multiple representations, they are more likely to have a better grasp of the concept and do better on assessments.

Third it is important to show multiple ways to solve the same problem so students see there is not just one way.  In addition, the more ways to solve a problem they are exposed to, the deeper their understanding becomes.  It is good to encourage students to find their own methods and if the methods are not quite right, it provides a powerful teaching moment.

Fourth, if possible connect the concept to the real world but if not, look for ways it connects in other subjects or even at its historical development.

Fifth,  have students take time to explain their reasoning when solving problems.  The reasoning should be done both verbally and in writing.  It improves their understanding if you give them 10 minutes to discuss reasoning with each other as they work to solve problems.

Finally, it is extremely important to include a summary during the final few minutes of class.  There are three things that can be done during this time.  The first is to do a quick assessment of student comfort with the concept.  Second is to review the objective and discuss where the class will be going next, and finally preview any homework together.

These are six simple steps designed to improve student understanding.  Let me know what you think. I'd love to hear.

Tuesday, February 6, 2018

Math and Snowboarding.

Snowboarding, Snowboarder, Sport, Fun  While visiting my brother, I had the chance to watch some extreme sports.  I watched someone on a snow board making multiple revolutions as he sped through the air.  I am not sure how many times around the athlete went but I know it was at least 4 times.  I was in awe of the wonderful skills needed to accomplish this.

Back in 2009, some students in Utah created a mathematical program designed to help the United States Snowboarding team decide which events to compete in the 2010 Winter Olympics.

Prior to this program being written, American snowboarders would compete in all the events they could in the hopes they would qualify for something but this program was designed to analyze the events to determine which events offered American Snowboarders the best chance of qualifying for the Olympics.  It was actually a spread sheet model which analyzed competition schedules, athletic scores, and financial costs to provide a ranking of the athletes most likely to make the Olympic Teams.  This is a perfect example of practical mathematical modeling.

In addition to this, there is math in every bit of snowboarding from the shape and length of the board itself, to the shape of the ride after taking off of the ground, to the spins involved in the turns.  Then there is the math involved in the physics with force, mass, acceleration, friction, and gravity.

Furthermore, there is quite a bit of math involved in designing the snowboard courses, especially the extreme ones you see on television.  Each year the athletes want to increase the height of the tricks, add more turns, make it more spectacular so the courses have to change and evolve to meet this need.

There are two major types of courses.  The first is The Big Air which is one long jump designed to have them to perform the biggest trick they can while the other is the slope style run.  The second one starts out almost level with rails, boxes, and grinds for tricks before the run heads off to three increasingly long jumps.  One important thing to keep in mind when performing these is to take into account gravity.

Designers use a simple ballistic calculator to took at what gravity does to moving objects especially if you know the angle and speed of the object because it helps calculate the distance and trajectory of the object.  It is possible to pinpoint where the object will land and as such the launch will have an angle of between 32 and 35 degrees while the landing area will have slope of between 34 and 37 degrees.  The landing zone must have this particular slope because if its too flat, the rider takes the downward force into their legs and if its too steep, riders cannot slow down properly and change the downward momentum into forward momentum.

On the slope style jump, the lip of the jump is four to eight feet above the ground because it gives them the hang time they need for tricks.  For both the slope style and the Big Air, the sweet spot for landing is between 55 and 75 feet from the point of launch. 

The above information is from this site. This company specializes in designing courses for extreme snowboarding and skiing competitions.

Let me know what you think.  I'd love to hear.


Monday, February 5, 2018

More on Math and The Winter Olympics

Blue, Colors, Competition, Event, Five  This past Friday, we looked briefly at the cost of putting on Olympic events and at the cost of going to one but what about the math involved in individual events?  Imagine making it more real by involving the students in judging some of the events or learn more about the torch.  The games begin on February 9th in South Korea.

Yummy Math has three activities geared for the 2018 Winter Olympics.  The first is an activity designed to give students an insight into the scoring of ski jumping.

The jumpers are judged on flight, landing, and outrun.  The judges are given a rubric to assign points as a way of eliminating personal preference and to obtain an objective score.  The pdf on this has some wonderful illustrations and explanations as the directions walk the students  through the whole process.  In addition, there are links for additional information on ski jumping.

The second activity looks at the distance the Olympic Flame travels from start to finish.  It traveled from Olympia, Greece where it was lit to Seoul, South Korea by plane before it was carried on land.  There is a map and the information needed to calculate how far each person  or robot carried the flame.  Yes, you read that correctly.  Three robots participated in carrying the torch along its 2018 km run in South Korea.

The final activity looks at the math involved in lighting the 2016 Olympic Torch in Greece.  They use a parabolic mirror to concentrate the suns rays to a point so enough heat is produced to light the torch.  The pdf has a lovely step by step guide showing how the rays bounce off the parabolic mirror.

Furthermore, Education World has provided a list of activities for the Winter Olympics.  Many of the activities listed are geared for the younger grades and some are not really math oriented but with a small adjustment, these can be turned into mathematical activities. 

One activity is to keep track of the medal winners and then create a variety of graphs to compare gold, silver, and bronze medals with each country's totals.  Rather than relying on premade worksheets with ski jumpers whose distance for the first and second jumps have already been set.  Let the students watch some of the events, mark down the jumps and use those to find totals to determine first, second, or third places.  If the events do not coincide with class time, you can always use the results from the newspaper or online.

There are so many different types of mathematical activities you can do with Olympic results from graphing, to determining over all rankings, to finding averages.  This site has some lovely suggestions for math projects related to the Winter Olympics such as ratios, scatter plots, and focus on outliers.

Finally is this blog with archived articles on the physics (mathematical equations) discussing spinning figure skaters, moving from a camel spin to a standing spin, projectile motion for Ariel Skiers, math and ski jumping, and scoring and ice skaters.

Involve students in real life math by bringing the Winter Olympics into the classroom.  Let me know what you think. I'd love to hear.


Friday, February 2, 2018

Olympics and Cost.

Bobsled, Team, Run, Olympics, Ice  It is that time of year when people are beginning to gear up for the Winter Olympics.  They begin on February 9th in South Korea and end on February 25.  I loved the Winter Olympics as I grew up because I was in awe of the ice skaters.  The men and women made the sport seem so easy and graceful.  The first time I tried ice skating, I fell a few times, felt as if my ankles were trying to fold faster than someone in a game of poker, and it left me sore.

I realized there are two ways one can look at the cost of the Olympics.  The first is the actual cost of the games themselves.  There are articles out there such as this one which states the Olympics hosted in London were predicted to cost $6.5 billion but ended up costing a whopping $20 Billion.  Almost 3 times the original amount. The games in Sochi ran $50 billion, making it one of the most expensive in history.  The Olympics in Rio were less expensive but still almost $5 billion, who knows how much of a hardship it was on the country's overall budget?  This site also  has a wonderful infographic on the percentage overrun of both summer and winter Olympics.  It appears that every set of Olympic games have experienced overages since 1960.

This article looks into how such a debt effects the countries after the games.  For instance, Montreal ended up with a debt of $1.5 million which took three decades to pay off.  This article has in infographic depicting the revenues earned from television broadcasting.  It also takes time to explain why several potential bidders for future games have withdrawn.

The other way to look at the Olympic Games is to look at the cost of attending the games.  One has to calculate the airfares, the hotel cost, food, souvenirs, tickets, etc.  Money has a sample budget for attending the Winter Olympics in 2018.  They calculate the cost is close to $5000 per person to attend only a few activities.  I looked up prices and if you could still get tickets for any event, you could be paying between $500 and $2000 for a package.

Although the article chose to use $950 for the average cost for airfare, its actually better to use the cost from your local airport because it adds a more realistic element.  I can guarantee traveling from Alaska to South Korea is going to run between $1500 and $2000 per person depending on the airline itself.  They quoted $1800 for the hotel for the Olympics but I've seen rates of more like $3500 to $7000 for the whole time through Booking.com.

It would be interesting to have students figure out the cost of a trip to the Olympics.

Let me know what you think.  I'd love to hear.

Thursday, February 1, 2018

Participating in Real Life Basketball Math.

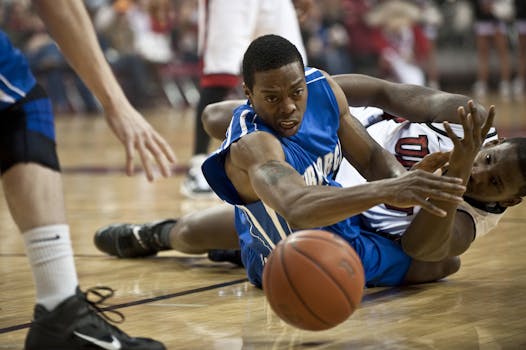
Free stock photo of sport, ball, game, match  Its that time of the year, when my school hosts a huge basketball tournament.  Usually both the boys and girls teams from eight different schools fly in or snow machine in to participate. 

The games started yesterday morning at 10:30 A.M., when our junior varsity team played against Bethel's junior varsity.  We lost by a significant margin but the girls played well.

About half my class is on either the girls or boys teams so they'd rather be in the stands watching others so they know the type of plays they will be up against while the other would just as soon skip class to watch the games.

With that in mind, I planned a week filled with basketball math so I could take them to the games and still continue to teach math.  I spend the first two days of the week teaching students to read box scores with field goals made out of field goals attempted, free throws made out of free throws attempted and 3 point field goals made out of attempts.  We worked on learning to read those scores so students could calculate the individual total scores and the teams final scores.

The next step was to have students calculate each players success from the list of scores.  The final step was to compare the players with the rates for professional players to get a better idea of how well the players in the exercise compare with professionals.  Most of my students really have no idea what a good success rate is nor do they know how to look at the over all picture.

This activity gave students a foundational knowledge of how basketball stats are calculated and how to compare the results to get an idea of who is a good player.  You probably wonder where I am going with this?  Since I take my students to the games, I give them an assignment to pick out a player and keep track of all the attempts made for one, two, and three points during the game.

Since each class is at a different time and the tournament is going have a winners and losers brackets, they will be observing different teams.  This I plan to have students analyze the players they chose, work with others to create their dream team based on these results. 

The final step in this will be to create a whole class discussion of all the results for two days of games so they can put together the dream team with suggestions from each group.  I am hoping this is a way to get students to see how the professional teams select potential players.

Let me know what you think.  Have a great day.