Monday, October 7, 2019

Conference - Thursday to Saturday of This Week.

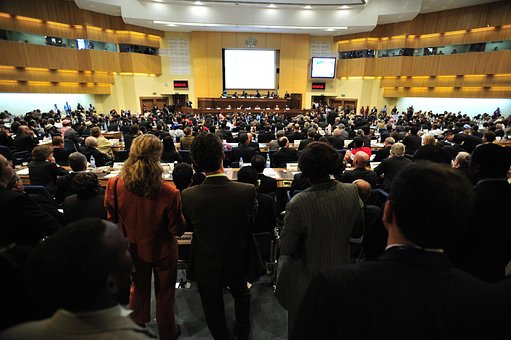
Meeting, Addis Ababa, Ethiopia, Hall I leave Wednesday  to attend the 58th Northwest Conference in Tacoma, Washington.  I admit, I look forward to it because I've signed up for a whole day of Desmos Workshops including one with Dan Meyer who is known for his three act tasks.

There are so many choices for Friday and Saturday.  Unfortunately, the conference has two types of activities.  There are 50 minute sessions up against 80 minute workshop sessions with hands on activities.

I've seen panels on storytelling in the math classroom, introducing quadratics naturally, the commonality between vertex form and logarithms, Superhero statistics, Math games, creating powerful  moments in the classroom, graphical transformations, similarities in geometry, mathematical discourse, concept circles in math,  spicing up the class with TI-84 activities, Formative Task matrix, proportional relationships, strategies for group work that work, making math meaningful with content integration, modeling our world with math, and so much more.

It is frustrating to have at least two different topics going at the same time with another one or two overlapping which makes it difficult to attend everything I want to know about.  I think I'll talk to others from the district and see if I can get their notes for the sessions I want information on but can't attend.  I know I'm going to undergo math overload but I also know I'll learn so much information to share and use in class.  I hope to take the one on using the TI-84 because I have several I am using in the classroom. I know some things about it but not as much as I should because I've been using Desmos for all my graphing needs.

Although there are several sessions focused on working with ELL students, I won't go this time because the school I'm at only has a few students who are classified as English Language Learners but I'm hoping to get to the session on RTI in middle and high school since many of my students are performing well below state averages.

There is one session on building activities around student lives and identities.  It has the teacher collect information and then create hands on activities using this information so as to make the lessons more interesting and relatable.  This sounds quite interesting but its at the exact same time is a talk on "nudging" students into using their own ideas during numerical talks.

I look forward to this and what I'll learn.  I hope to meet new people and perhaps get a chance to meet any of you who read this blog.  Have a great day.


Sunday, October 6, 2019

Warm-up

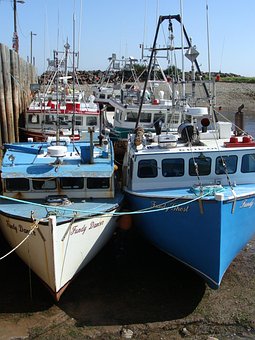
Boats, Bay Of Fundy, Tide Out, Summer

The average tidal range is 3 feet in most places but in the Bay of Fundy, the tidal range is 53 feet.  What is the percent difference?

Saturday, October 5, 2019

Warm-up

Maine, Bay Of Fundy, Harbor, Islands

The Bay of Fundy takes 6 hours to rise 50 feet.  What is the rate of change?

Friday, October 4, 2019

Bloom's Taxonomy in Math

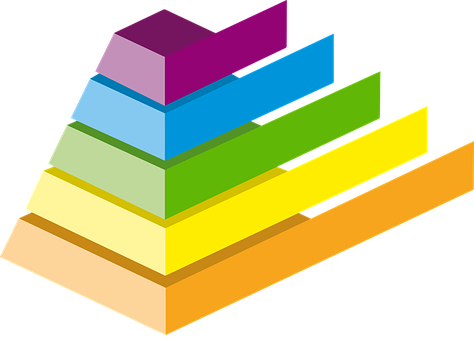
Pyramid, Chart, Colours, Infographic One thing we hear about on a regular basis is Bloom's Taxonomy, it's levels and we are told we need to use it to help our students develop higher level skills but we don't always get ideas on how to use it in math.  I am always looking for suggestions to use it in my classes but I don't always no how.

The first or lowest level is simply recalling information such as knowing your multiplication tables, addition and subtraction facts, or knowing the steps to slow an equation without understanding why.  This level is a basic level where they repeat, list, memorize, or define.  Students often confuse memorizing steps with understanding what they are doing.

The next level is understanding or comprehension where they tie basic knowledge to understanding.  Understanding refers to being able to explain the concepts via instructions such as recognize, translate, discuss, or describe.  In other words, students can describe what they are looking for and why. An example might be paraphrasing how to find the area of a triangle or a circle. Once they have developed understanding, they open the door to creating, applying, analyzing, and evaluating.

Applying refers to applying the concept in a new way such as the distributive property to show multiplying two digit numbers or binomial multiplication.  This steps is identified as demonstrate, illustrate, solve, and interpret.  One good way to have students to apply information is to compose an explanation of a topic for others, or create a diagram or photograph of certain fractions.

Creating means students take the understanding and creating something new with it.  If you see an instruction of assemble, construct, design, develop, or formulate.  One way of creating in math is when students create their own word problem or problem for a specific topic.  Another might be asking students how they can figure out the number of dimes in a car without counting them, or create a new monetary system.

Evaluate is the stage where students can justify their position.  This level is indicated by select, support, defend, value, or evaluate.  In other words, if students conclude a product is a better purchase, they can explain why.  An example might be having students consider what criteria they'd use to determine if their answer is correct or come up with a proof and justify each step.

Finally is analyze where students distinguish between the parts using compare, contrast, differentiate or examine.  An example of this might be classifying different functions or comparing and contrasting natural logs with regular logs.  Another example would be to have students figure out what strategies they could use to solve a word problem, or use a Venn diagram to compare and contrast two different topics.

So if you want to apply Bloom's Taxonomy to your math class, you know have some basic information to do so.  Let me know what you think, I'd love to hear. Have a great day.


Thursday, October 3, 2019

Using Task Cards In Math.


Business Card, Business, Card, ManOne of the new teaching strategies I've run across is the use of task cards.  Task cards are defined as a card that has an activity or question on it and is the size of a small card no larger than a 3 by 5 index card.  Some task cards have pictures on them to show what is to be done or they might have written instructions.    Task cards come in two types.  The first asks a question that requires an answer from the student while the second suggests an activity the student should do.

Question task cards are found in several variations.  These cards may be multiple choice, long or short answer, or fill in the blank while the activity cards ask students to do something.  The activity cards require that the teacher have extra materials available for the activity.

Task cards are considered superior to worksheets since they can be more motivating.  They also require less reading which for students who have trouble reading, this means they are more comfortable in completing the task.  Worksheets can have more words than struggling students are willing to read at any one time.

In addition, students feel a sense of accomplishment by completing the task when these same students struggle to finish a worksheet.  Task cards are much easier to differentiate than worksheets and students are able to choose a task they can complete.  For instance, if you have task cards, some with multiple choice, some with long answer, students can select the one they are better able to finish.  Another possibility is to create cards with different levels from easy to hard so students can choose the card they want.

Furthermore, task cards can be designed for individuals, small groups, whole groups, learning centers, or even as part of a game.  When task cards are used for individuals, each student gets a card to do or students can take the task card home to do it at home after school.  Another way is to give every student a card to answer.  Once they've written the answer down on a white board, or paper, the teacher tells them to move one over and they to a new location where they answer a new card.  They continue the movement until they've done every card.

Another use is to divide the class up into pairs who sit or stand back to back.  The teacher reads the task card to the class.  Each student answers the question on a whiteboard and when they both have answers, they compare to see if they came up with the same answer.  Or divide the students into two groups.  Have one group sit in chairs facing inward while the other group faces out so they are face to face.  Pass out one task card to each set of two and they work on the answer together.  After a couple of minutes, ask students to move, one group goes left while the other goes in the opposite direction.

When used with small groups, the teacher can read one card and have all the students work on the same problem.  The ability level of the card is determined by the level of the group.  Furthermore, the tasks can focus on specific skills as needed.  

Task cards are also great bell ringers or warm-up questions, exit ticket tasks, or if your students finish the assignment earlier than expected, have them do some task cards. Keep extra sets in the classroom for anytime you need a filler.  Task cards are handy.

Let me know what you think, I'd love to hear.  Have a great day.


Wednesday, October 2, 2019

That Time Of Year!

Money, Finance, Financial, Cheque, Check  It is the time of year again, when the state of Alaska sends out a check to every qualified resident.  In 2015, they sent out over 680.000 checks for a state with a population of over 725.000.  If you have a bank account and ask fo it to be direct deposited, you get it the first day of October, otherwise you have to wait a few more days.

This year, the dividend sent amounted to $1606, just six dollars more than the dividend issued in 2018.  The State of Alaska of publishes information on the Permanent Fund Dividend from 1982 when they began sending money out to people.  They provide enough information to great a variety of graphs.

For the years 1982 to 2016, the State has a chart with the year, the state population, the number of applications received, the number of applications paid, the amount of the dividend, the percent of change from the previous year's amount, and the total amount of money distributed.

These numbers provide so many opportunities for students to graph the information in a variety of ways.

1.  Students can calculate the percent difference between the  number of applications paid and the state population for each year and graph that.

2.  Students can calculate the percent difference between the number of applications received and the number of applications paid.

3.  Students can graph the amount paid each year vs the price of crude oil to see if there is a correlation between the two.

4.  Students can graph the percent change from amount paid year to year to view how it changes over time.  This information could be used to create a line of best fit.

5.  Students graph the yearly total amounts paid out to all the applicants, to see how much is spent every year.

6.  There are also totals from 1982 to 2016 for applications received, applications paid out, dividend per person, and total amount dispersed to obtain an average per year for each of these categories.

This is real life data for those of us who live in Alaska.  Many people spend their money to buy new snow machines or ATV's, go on trips, or even buy new clothing.  I'm using mine to pay for a new heater for my house.  It should almost cover the cost.  Not quite but almost.

Let me now what you think, I'd love to hear.  Have a great day.

Tuesday, October 1, 2019

Reading Math and Annotation.

Homework, School, Problem, Number, PaperYesterday, I realized my students read the problems but they don't know how to analyze the meaning of the words in terms of mathematics.  My students are learning about complementary, supplementary, adjacent, and vertical angles, and linear pairs.

We defined all the terms, went through the appropriate drawings, discussed each item but when it came time to do the work, they didn't take time to relate the questions to the new material.


So today, I plan to go over the examples in the book but include discussion on taking the vocabulary in the questions and relating it to the new material.  For instance, one question asks students to name pairs of adjacent complementary angles.  The students tried to answer the question by guessing rather than determining exactly what the question wanted.

We are going to rewrite the question after defining the words.  So pairs require two angles or groups of two angles.  Adjacent means they have to be next to each other and complementary means the angles add up to 90 degrees.  So the question is asking students to find at least two angles that add up to 90 degrees.  Then I'll have them look at the diagram to see if there are at least two matching this.

Another question asked if you have two complementary angles and one angle is 32 degrees what is the other angle?  We know that the complementary angles add up to 90 degrees, so 32 + X = 90.  I'm going to introduce algebra to help them see that algebra can help solve geometric problems.

My students tend to score much lower on language and reading than they do on math but they tend not to do as well when language is involved.  Equations yes, language no, so taking time to help them look for meaning in the words, will help them do better on future tests.

From today on, as I work through examples for each section, I plan to model looking at the definitions of mathematical words, relating them to the section's vocabulary, asking myself what they are actually asking.  Students too often want to know how to do the assignment without knowing or wanting  to look at the nuances of the problem.

This will require students to learn to annotate on the side, just like they do in their regular English class. Annotating is a way for the reader to interact with the text to increase a readers understanding, ability to recall information, while creating a connection.  In Math, annotating means looking at the meanings of words, finding information to answer the question.  So that is what I'll be teaching students today.

I'll let you know how it goes.  Let me know what you think, I'd love to hear. Have a great day.