Monday, December 30, 2019

Celcius vs Fahrenheit. Formulas vs Graphs

I usually teach converting temperatures from Celsius to Fahrenheit and the other way using the standard formulas.

If you want to go from Celsius to Fahrenheit you use the C = 9/5 F + 32   while F = 5/9(C-32).  These work ok until you ask students at what temperature are both Celsius and Fahrenheit the same.

This is when I promptly lose them because they don't realize they can determine the answer in one of two ways.  They can either set the two formulas to be equal or they can graph.

As you can see if you replace the C or F with x and y, you can graph the two linear equations and they cross at the point (-40, -40).   This means when the Celsius temperature is -40, the Fahrenheit is -40 and vice versa.    I got the idea the other day as I was looking at the formulas and realized the formulas are basically linear and I could easily create a visual representation using Desmos.  You see the results in the photo above.

The other way is to set them equal to each other and solve:

9/5 x + 32 = 5/9(x-32)

9/5 x + 32 = 5/9 x - 160/9

9/5 x + 288/9 = 5/9 - 160/9

9/5 x = 5/9 x - 448/9

9/5 x - 5/9 x = -448/9

81/45 x - 25/45 x = -448/9

56/45 x = -448/9

56 x = -2240

x = -40

This means the value has to be -40 for the two temperatures to be equal.

You could have done each equation separately by subbing x in so it looks this way

x = 9/5 x + 32
-4/5 x = 32
x = -40

or

x = 5/9( x - 32)
x = 5/9 x - 160/9
-4/9 x = -160/9
(-9/4) (-4/9x) = -160/9 * -9/4
x = -40

So there you have it.  -40 Celsius is -40 Fahrenheit and a way to prove it.  Have a great day and enjoy yourselves.  Let me know what you think, I'd love to hear.


Sunday, December 29, 2019

Warm-up

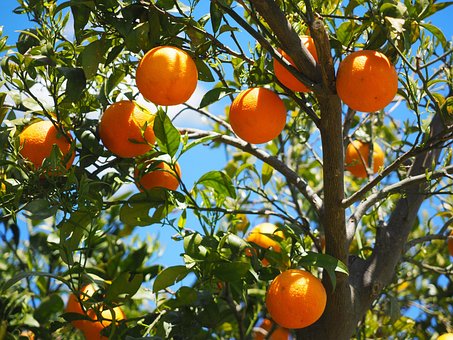
Orange Tree, Oranges, Tree, Fruit

If it takes 16 oranges to make 59 ounces of juice, how many oranges do you need to make 1 gallon of juice?

Saturday, December 28, 2019

Warm-up

Oranges, Fruits, Orange Tree

The average tree produces 325 oranges per year.  If your orchard has 90 trees in it, what is the total crop for the year?

Friday, December 27, 2019

Slowmo, stop motion, and Animation in Math.

Explosion, Exploding, Pop Art, Boom I have been trying to think of ways to improve instruction and learning in my math class.  In math, we say if a student can explain their thoughts and how they came up with the answer, they are showing understanding but it seems to me that if they can create a video showing their thinking, that works.

Animation is a great way to create equations and move things around without you standing there and explaining every step. Instead, you can have the terms move on screen by themselves, or move to the proper spot.

I have used keynote to create animation showing how two shapes were congruent using transformations.  I used keynote because that is the presentation software I know well.  Right now, I am working on learning to use Google slides for the same thing.  I have several ideas I want to bring to life using animation.

1.  Instead of talking about slope, why not create animation so the word positive climbs diagonally up towards the top, then the word negative is going down to the starting level, the zero slope is a flat area and undefined is a cliff but I'm seeing the words appearing one letter at a time.


I made a quick animation showing the idea for slopes.  My students do not always stop to think about which slope is associated with upwards, downwards, flat, or straight down.  My art isn't the best so forgive me.  I used animation HD for kids.  It was free and so easy to use.


2.  Showing how to solve various equations using animation.  You can have the terms move or you could arrange for a train or other vehicle to move the terms around.  In addition, it is possible to put music in the background or voice over to explain why.

3. Stop motion can be used to show how the area of a circle comes from the circumference of a circle.   If you cut the circle into certain shaped pieces and rearranged, you can rearrange the sections into a parallelogram.

4. Students can create their own characters who talk about a problem on the board, each step done via stop motion or slow motions.


This video was made with Toontastic on my iPad.  I used the characters from it and the three part storyline.  It was an easy app to use.  If you notice, my characters spoke about slope in general as seen or experienced in real life.  It was not that technical in terms of finding the slope itself and it explored the idea that a slope could be positive or negative based on which direction you are going.

The above are just a few suggestions plus two short videos I made using two different apps.  Let me know what you think, I''d love to hear.  I hope these videos work properly.  Have a great day.


Monday, December 23, 2019

Christmas Infographics

Christmas Car With Tree, ReindeerThis is the perfect time of year to sneak in reading or creating infographics.  The holiday season has so many different possibilities for learning to read and interpret infographics.

This is a skill we need in today's society because society has moved to sharing information via infographics rather than the standard graphs.

This site has a something like 12 different Christmas related infographics.  My favorite one is the one that looks at the best selling toy each decade beginning with 1910.  The graphic includes prices for each toy adjusted for inflation and the prices are in pounds so students have to convert the unit of currency.  In addition, the toys are divided into genders.  The other thing is this infographic records the change of consumer tastes over the time.

Another infographic addresses Christmas and pets which looks at the number of families who see pets as members of the family, how many presents they buy their pets, and which gender is more generous.  One of the infographics I find most interesting is the one outlining why being Santa is the most dangerous job out there.  The infographic looked at everything from number of children and stops to how fast Santa has to travel to do it all, and snacks left for Santa in various parts of the world.

This site has 9 infographics which are different from the first one.  There is one infographic on the ugliest sweaters at Christmas.  Although it looks at ugly sweaters, this infographic actually breaks down the number of sweaters purchased by region and around the world from this place.  Another infographic explores the safety of Christmas trees from buying them, to caring for them, to disposing of them.  The infographic even took time to look at what causes Christmas tree fires.  Unfortunately, not all the links in the above two sites are live.

This site is one big infographic on the economics of the holiday season.  It looks at economic growth, mortar growth, global e-commerce growth, target audience and spending,  Towards the end is a section where they give hints to vendors on ways to improve their chances of increasing their sales.  It is a very interesting graphic.

This site has tons of Christmas infographics including the most popular recipes, the history of Christmas trees, Christmas dinners, greatest holiday movies, and so many others.  Most of these infographics are fairly short with 5 dinner infographics, 5 destination infographics, but they all have some nice information.  I checked out the one on Christmas cards.  It looked at the anatomy of a Christmas card, one on showing the insight into holiday marketing for businesses, facts about Christmas cards, the 12 days of Christmas, and breaking down the gift card trend.

I love the way this last site is done because you can break the class up into smaller groups, assign groups to interpret each category, or individual infographics in each category.  Students can present their findings via Flip-grid, Google Slides, or any other digital method.  Let me know what you think, I'd love to hear.  Have a great day.


Sunday, December 22, 2019

Warm-up

Christmas, Tree Decorations

You just paid a Christmas Tree decorator $213 to place your lights, ornaments, and tinsel on the tree.  It took her 3 hours to complete the job.  How much did you pay her per hour?