Friday, January 3, 2025

Cost Of Cleanup After Ringing In The New Year

Free Nyc New York photo and picture

 New Year's Eve in Times Square is a global spectacle. Millions watch the iconic ball drop, confetti rains down, and the city erupts in celebration. But the magic fades quickly, leaving behind a mountain of debris. The cost of cleaning up after this massive celebration is a significant undertaking, both financially and logistically.

Imagine this, tons of confetti.  This is the most visible and iconic part of the celebration, but it also creates a massive cleanup challenge.  Countless beverages are consumed, leaving behind a sea of plastic waste. From hot dogs to snacks, the revelry inevitably generates a significant amount of food waste and containers. In addition, there are tons of lost gloves, hats, and even shoes add to the chaotic mix.

The clean up process requires a ton of clean up workers. A massive team of sanitation workers, volunteers, and Department of Sanitation (DSNY) crews descend upon Times Square immediately after the clock strikes midnight. They use high-powered vacuums, street sweepers, and specialized vehicles are deployed to tackle the massive amount of debris. Also workers meticulously pick up smaller items, sweep sidewalks, and remove any hazardous materials. Furthermore, the cleanup operation requires meticulous planning and coordination between various city agencies and private contractors.

The cost of cleaning up Times Square after New Year's Eve is substantial. The city has to pay overtime to sanitation workers and deploying additional personnel which significantly increases labor costs. The city has to pa for the  use of specialized equipment, such as high-powered vacuums and street sweepers, adds to the financial burden. Then they have to pay to properly disposing of the collected waste, including recycling and composting, also incurs costs.

There is a cost that goes beyond the financial.  There is an environmental impact because the sheer volume of waste generated has environmental consequences. Efforts are made to recycle and compost as much as possible, but the environmental impact remains a concern. In addition, ensuring  a swift and thorough cleanup is crucial for public health and safety. Leaving debris unattended can pose health hazards and attract pests. Furthermore, the efficient and effective cleanup of Times Square after this global event is essential for maintaining the city's image and ensuring a positive experience for residents and visitors alike.

The city faces a delicate balancing act: hosting a world-renowned celebration while minimizing its environmental and financial impact. Implementing more sustainable practices, such as using biodegradable confetti and encouraging the use of reusable containers, is crucial. Educating the public about responsible waste disposal during the celebration can significantly reduce the cleanup burden. The city continually evaluates and refines its cleanup strategies to improve efficiency and minimize environmental impact.

Finally, the cost of cleaning up Times Square after New Year's Eve is a significant undertaking, encompassing financial, logistical, and environmental considerations. While the celebration brings joy and excitement to millions, the city must work diligently to minimize its impact and ensure a clean and safe environment for all.  The exact amount is not known and it varies from year to year but this is an overall look at the factors involved in cleanup.  Let men know what you think, I'd love to hear.  Have a great weekend.

Monday, December 30, 2024

How Do States Calculate Lottery Amounts

Free Bingo Ball illustration and picture 

Have you ever wondered how each state or regional lottery calculate the amount of money for each drawing?  I have since sometimes it seems to grow almost exponentially once it hits a certain threshold.

The amount of money available for each lottery drawing is determined by a complex interplay of factors, including ticket sales, prize payouts, operating expenses, and reserve funds. Here's a breakdown of the key elements involved in this calculation:

  1. Ticket Sales: The most obvious factor influencing the prize pool is the number of tickets sold for a particular drawing. More ticket sales generally translate to a larger pool of money to be distributed as prizes.

  2. Prize Payouts: Lottery games have various prize tiers, from smaller consolation prizes to the grand jackpot. The total amount allocated to these prizes is a significant portion of the overall prize pool.   

  3. Operating Expenses: Lotteries incur costs associated with running their operations, such as:

    • Salaries and benefits for employees
    • Advertising and marketing
    • Retailer commissions
    • Technology and equipment maintenance
    • Administrative overhead   
  4. Reserve Funds: States often maintain reserve funds to ensure the financial stability of their lottery programs. These funds help cover potential shortfalls in revenue or unexpected expenses.   

  5. Jackpot Rollover: When no one wins the jackpot in a particular drawing, the prize money typically rolls over to the next drawing, increasing the potential payout. This can lead to substantial jackpots that attract even more ticket buyers.   

The specific formula used to calculate the prize pool can vary from state to state, but it generally involves a combination of these factors. The goal is to strike a balance between offering attractive prizes to entice players, covering operating costs, and maintaining financial reserves for the long-term sustainability of the lottery program.

Here's a simplified example of how a state might calculate the prize pool for a drawing:

  • Total ticket sales: $100 million
  • Operating expenses: $20 million
  • Reserve fund contribution: $10 million
  • Remaining amount for prizes: $70 million

This $70 million would then be allocated to the various prize tiers based on the game's specific payout structure.

It's important to note that the actual calculations are much more intricate and involve detailed financial modeling and projections. Lottery administrators carefully analyze historical data, market trends, and economic conditions to make informed decisions about prize structures and reserve fund allocations.

In conclusion, the amount of money available for each lottery drawing is a carefully calculated figure that reflects a balance of ticket sales, prize payouts, operating expenses, and reserve funds. This complex calculation ensures that the lottery program remains financially viable while offering exciting prizes to attract players and generate revenue for the state. Let me know what you think, I'd love to hear.

Friday, December 27, 2024

The Unlikely Sequence: Consecutive Numbers in a Lottery

Free Lotto Lottery Ticket photo and picture

The recent Mega Millions drawing, with its four consecutive numbers (66, 67, 68, and 69), has sparked widespread curiosity. How likely is such an occurrence? To understand the odds, we must delve into the realm of probability and combinatorics.

Calculating the Odds

In a standard lottery, each number is drawn independently and randomly from a pool of possible numbers.  Let's assume a simplified lottery with 70 numbers, similar to the Mega Millions setup. The total number of possible combinations for four numbers drawn without replacement is given by the combination formula:   

C(n, k) = n! / (k!(n-k)!)

where n is the total number of numbers and k is the number of numbers drawn. In our case, n = 70 and k = 4. This gives us:

C(70, 4) = 70! / (4! * 66!) = 1123850

So, there are 1,123,850 possible combinations of four numbers.

Now, let's consider the number of combinations with four consecutive numbers. If we start with 1, the sequence would be 1, 2, 3, 4. We can shift this sequence up to a maximum of 67, giving us 67 possible sets of four consecutive numbers.

Therefore, the probability of drawing four consecutive numbers is:

P(consecutive) = 67 / 1123850 ≈ 0.0000597

This translates to approximately a 0.006% chance, or roughly 1 in 16,775.

While not impossible, drawing four consecutive numbers in a lottery is highly unusual. The extremely low probability suggests that such an event is statistically significant. However, it's crucial to remember that each lottery draw is independent. The occurrence of consecutive numbers in one drawing does not affect the probability of future draws.

Some additional considerations include lottery specific rules since the  actual odds may vary slightly depending on the specific rules and number pool of the lottery in question. Furthermore, it's worth noting that humans are often drawn to patterns and sequences. This can lead to biases in number selection, potentially making certain combinations, like consecutive numbers, seem more likely than they actually are.

In conclusion, while the recent Mega Millions drawing with four consecutive numbers is a rare event, it's not entirely impossible. Understanding the underlying probability calculations helps us appreciate the statistical significance of such occurrences.  Let me know what you think, I'd love to hear.  Have a great weekend.

Monday, December 23, 2024

Bringing Statistics to the Holidays: Festive Fun with Data

Free Christmas Christmas Tree photo and picture

The holiday season, with its abundance of gifts, traditions, and gatherings, provides a unique opportunity to engage students with real-world applications of statistics. From analyzing Christmas tree sales to predicting New Year's Eve celebrations, here are some festive ideas to bring data to life in the classroom:

1. The Great Christmas Tree Survey:

  • Data Collection: Have students survey their classmates or families about their Christmas trees. Collect data on tree type (real vs. artificial), height, number of ornaments, and unique decorations.
  • Data Analysis: Calculate the mean, median, and mode for each variable. Create bar graphs and histograms to visualize the data. Explore the relationship between tree type and the number of ornaments.
  • Classroom Activities:
    • Conduct hypothesis tests to compare the average height of real and artificial trees.
    • Use statistical software to create scatter plots to investigate if there's a correlation between tree height and the number of decorations.
    • Have students design their own surveys with relevant statistical questions.

2. The Festive Food Frenzy:

  • Data Collection: Collect data on the most popular holiday dishes among students and their families. This could include surveys, food diaries, or even a "favorite holiday food" election.
  • Data Analysis: Create pie charts to visualize the proportion of students who prefer different dishes (e.g., ham, turkey, lasagna). Calculate the percentage of students who enjoy specific desserts.
  • Classroom Activities:
    • Investigate the relationship between age and food preferences.
    • Analyze the impact of cultural background on holiday food choices.
    • Have students design a healthy holiday menu using statistical data on nutritional value.

3. The New Year's Eve Countdown:

  • Data Collection: Research historical data on New Year's Eve celebrations, such as the number of people attending Times Square, the most popular New Year's resolutions, or the number of champagne bottles sold.
  • Data Analysis:
    • Create time series plots to analyze trends in New Year's Eve celebrations over time.
    • Use regression analysis to predict the number of attendees at a future Times Square celebration.
    • Investigate the most common New Year's resolutions and their success rates.
  • Classroom Activities:
    • Have students collect data on their own New Year's resolutions and track their progress.
    • Conduct a class survey on their predictions for the upcoming New Year.
    • Use statistical software to analyze the results of the class survey and compare them to national trends.

4. The Gift-Giving Game:

  • Data Collection:
    • Have students collect data on the number of gifts they received, the average cost of gifts, and the most popular gift categories.
    • Explore the concept of "gift exchange" using simulations and probability calculations.
  • Data Analysis:
    • Calculate the mean, median, and mode of the number of gifts received.
    • Create a box plot to visualize the distribution of gift costs.
    • Investigate the relationship between the cost of a gift and the recipient's age.
  • Classroom Activities:
    • Have students design a "fair" gift exchange game using probability and random number generators.
    • Explore the concept of "expected value" in the context of gift-giving.

5. The Holiday Lights Extravaganza:

  • Data Collection:
    • Have students observe and record the number of holiday lights displayed on houses in their neighborhood.
    • Collect data on the types of lights used (e.g., LED, incandescent) and the duration of light displays.
  • Data Analysis:
    • Create a frequency distribution table to analyze the number of houses with different numbers of lights.
    • Investigate the relationship between the number of lights and the type of house (e.g., size, location).
    • Explore the environmental impact of holiday lighting using data on energy consumption.
  • Classroom Activities:
    • Have students design a "most festive house" competition using statistical criteria.
    • Use data on energy consumption to calculate the cost of holiday lighting and explore ways to reduce energy usage.

Benefits of Using Statistics in the Holiday Season:

  • Real-world Applications: Students can see how statistics are used in everyday life, making learning more engaging and relevant.
  • Increased Motivation: The festive context can increase student interest and motivation in learning statistical concepts.
  • Collaborative Learning: Many of these activities encourage teamwork and collaboration among students.
  • Critical Thinking: Students develop critical thinking skills as they analyze data, draw conclusions, and make predictions.

By incorporating these festive activities into your classroom, you can make statistics more enjoyable and meaningful for your students while celebrating the spirit of the holiday season.  Let me know what you think, I'd love to hear.  Have a great day. 

Friday, December 20, 2024

QR Codes: A Modern Tool for Math Class

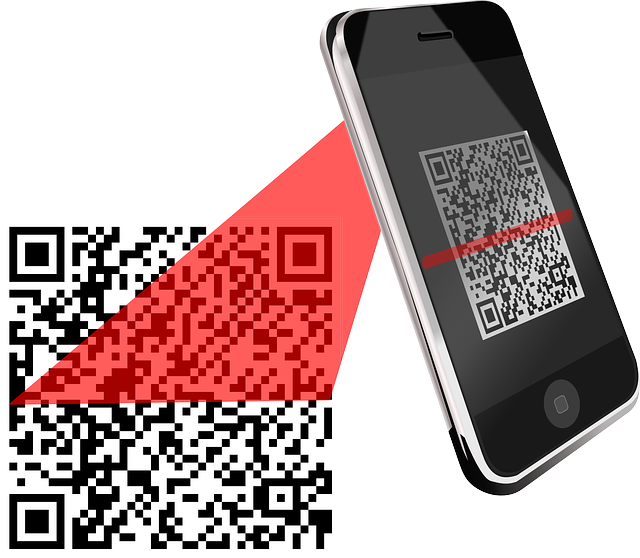
Free Qr Code Scanner vector and picture

 QR codes, those square barcodes that can be scanned with a smartphone, have become a versatile tool in various fields, including education. In mathematics classrooms, QR codes offer a dynamic and engaging way to enhance learning and assessment.   Even if your school prohibits the use of mobile phones in the classroom, QR codes can still be used.  So time to look at specific ways to integrate QR codes into the math classroom.

QR codes allow instant access to resources. Link  QR codes to online textbooks, worksheets, or interactive activities.Students can access these resources instantly on their devices.   Embed QR codes on worksheets or handouts to direct students to video tutorials that explain concepts in more detail.   Or link  QR codes to online math games and puzzles to reinforce learning and make practice fun.   

In addition, QR codes can be used for interactive learning activities such as in a scavenger hunt by creating  a series of QR codes placed around the classroom or school. Each code can lead to a math problem or a clue to the next location.   For self-paced learning design  a series of QR codes that guide students through a specific topic, allowing them to work at their own pace. Consider using  QR codes to facilitate group activities. For example, divide students into groups and assign each group a QR code that leads to a different part of a problem.

Furthermore, QR codes can be used for assessment and feedback.  Create QR codes that link to online quizzes or surveys. Students can complete these assessments independently and receive immediate feedback.   Or use  QR codes to link to peer assessment rubrics or checklists. Students can use these tools to evaluate each other's work.  Include QR codes on worksheets or assignments that link to reflection prompts or journaling activities.

If your classroom has mobile devices have students scan QR codes directly with their smartphones or tablets.   If student owned devices are prohibited in the classroom, you can provide  students with devices to access QR codes during specific activities if you have a classroom set of devices.  

For classrooms without mobile devices, use  QR code readers to project the content onto a screen for the whole class to view or print out QR codes and distribute them to students. They can then scan them using a computer or a smartphone.   If you assign homework, put a QR code in the corner with all the answers so students can check their work.

When you use QR codes in math class, ensure  that the use of QR codes aligns with specific learning objectives. Design activities that empower students to take ownership of their learning and use  a variety of QR code activities to keep students engaged. When using QR codes,  consider students with disabilities and ensure that QR code activities are accessible to all learners.  Always provide  clear instructions and support as needed.

By incorporating QR codes into math instruction, teachers can create dynamic and engaging learning experiences that cater to the diverse needs of their students.  Let me know what you think, I'd love to hear.  Have a great weekend.