
Saturday, July 7, 2018

Friday, July 6, 2018
Math and Star Wars
 Star Wars, the first movie was released back in 1977 to huge
audiences. It made enough to lead to two more movies before a break.
Eventually the three movies covering the time before the originals were
released. Who can forget JarJar Binks with his bounciness and ability
to drive adults crazy? Now we are up to the 2nd of the last three in
the 9 movie concept. And - The series has spurned two other movies,
Rogue One and Han Solo both giving more background to the Star Wars
universe.
Star Wars, the first movie was released back in 1977 to huge
audiences. It made enough to lead to two more movies before a break.
Eventually the three movies covering the time before the originals were
released. Who can forget JarJar Binks with his bounciness and ability
to drive adults crazy? Now we are up to the 2nd of the last three in
the 9 movie concept. And - The series has spurned two other movies,
Rogue One and Han Solo both giving more background to the Star Wars
universe.Fortunately there is a math activities available via Yummy Math to use to analyze the net profit based on production costs and world wide gross. The activity also brings into account the idea of inflation and how the costs were different in 1977 vs now. Back then a Hershey bar was only 20 cents rather than the $1.00 of today. Students are introduced to inflation calculators so they understand the concept of in 2018 dollars when they see the comment.
We always want to incorporate reading into our math classes so students become better at interpreting what they read. There is this great article which does a statistical analysis of the different worlds found in the Star Wars movies. They used Graph Theory to analysis the information to reach certain interesting conclusions. For students such as mine who hate to read, you can create a sheet to accompany the reading so they look for specific information or the questions could require some mathematical calculations and conclusions based on the information.
Mathematic shed has a variety of activities for a variety of ages. Some require solving equations while others require students to propose a hypothesis on what a certain number might represent. There is also an infographic on the cost of the Death Star, students can use to find the answers to questions you create. There are some for adding basic numbers for elementary students but I ignored those because they are a bit young for my students.
Then this site has a nice activity for creating a Star Wars Galaxy similar to the activity students do in the gym to set up the solar system. The good thing for my students with this activity is that it requires students to convert from metric to standard which is something they struggle with.
This site has links to 15 activities based on Star Wars including a coordinate plane activity, fraction activity, and drawing R2D2 which some of my students would enjoy. Although many are geared for elementary students, a few are geared for older ones.
I may have to have a sub for the first couple days of class this year so I may set up a unit starting with one of the movies, followed by some of these math activities to ease my students back into work.
Let me know what you think, I'd love to hear.
Thursday, July 5, 2018
Futurama - Hidden Math Gems
 Many of my students love watching certain cartoons such as The Simpsons or Futurama. I know there is lots of wonderful math in The Simpsons but what about Futurama? What math does it have shared in the 14 years it was on television?
There are lots of math jokes running through the show. In fact almost every episode has a math reference, some are only known to mathematicians. Three of the show's writers have PhD's including Ken Keeler who has one in applied mathematics.
Let's look at some of those jokes sprinkled through the series. Some are puns and some are out right jokes. So lets take a look at some of the wonderful references.
1. "What's non-orientatable and lives in the ocean?" A Mobius Dick of course referring to a four dimensional whale based on a Mobius Strip.
2. In another episode, one of the characters sees 1010011010 written in blood on a mirror in a haunted castle. Most people do not read binary but if you did, you would know the number is actually 666 associated with the beast.
3. One of the space ships has the registry number of BP-1729. 1729 is the smallest sum from two different positive cubes combined in two different ways. The same number is assigned to a unit of soldiers. Furthermore, it is assigned to the universe in Farnsworth Paradox.
4. A taxi cab has the number 87,539,319 which is the smallest number made from three positive cubes combined in three different ways.
5. In another episode, the artists snuck P vs NP on two books found in a bookcase of books. P problems are easy to solve, NP are not but answers to NP problems can be checked.
6. How about a dating agency that advertises that is is both discreet and discrete. Remember discreet refers to protecting client identities while discrete refers to data that does not vary smoothly or continuously.
7. Then there is the episode with the club "1^2 2^1 3^3 which is a play on Club 54, a very famous night club.
8. One of the writers ended up proving a theorem from the episode where the brains of two people were switched in "Prisoner of Brenda" but cannot be switched back. The theorem known as Keeler's Theorem proved that no matter how mixed up people's brains are, all you need to do is bring in two new brains and everyone can get their own brain back.
9. The local theater is Loews ℵ0 plex with an infinite number of screens. Alepha naught or ℵ0 refers to the different sizes of infinite sets which change based on the scale. Since ℵ0 is the smallest cardinal number for the set, every one has an ℵ0.
10. In an episode with a horse race, the track uses a quantum finish to determine the winner but all that means is when they measure results, the results are changed because its based on the observer.
There are other references to Banach Tarski theoretical paradox, a beer called Klein's with an odd-shaped bottle based on Klein's bottle, and other unique things. There are lots of fun references, many of which are only understood by math people straight off but knowing this, one can play clips from the show and then brig the math into the classroom this way.
Let me know what you think, I'd love to hear. Have a great day.
Wednesday, July 4, 2018

Tuesday, July 3, 2018
Stats of Growing Old.
 The other day, in the local paper, I read an article on how old can people live too. The oldest people end up living to 115 or 120 but the article had some awesome statistics on this topic.
 The article mentioned the Gompertz law formulated by Benjamin Gompertz in 1825 suggests the odds of dying double every eight years for people between the ages of 30 and 80. After the age of 80, it appears that rates begin slowing down until they plateau between 105 to 110 years.
The law does not actually look at the odds of living to a certain age. The odds of a woman living to the age of 110 is 2 in 100,000 but the odds of a man living to the same age is 2 in 1,000,000. The odds are vastly different.
Other odds given in the article state if you reach the age of 105, there is a 50 percent chance you will reach 106. The 50 percent chance applies each year you live past 105. So if you are 106, there is a 50 percent chance you'll reach 107 and a 50 percent chance you'll get to 108 years old. Its the same as flipping a coin for heads or tails.
That sounds like a decent set of odds but once you add numbers to it, it isn't as good. Think about it. If only 2 men are alive at 110, that means 4 at 109, 8 at 108, 16 at 107, and continue to work backwards. It shows that not that many are alive at 105.
The article itself claims there are 3,373 women and 463 men in Italy who lived to the age of 105 and beyond. These folks were born between 1896 and 1910. There were four born in 1896 who lived to 105 or beyond while over 600 people born in 1910 lived to the same age. That is a tremendous increase. The article said the increase was due to improved infant survival and the care of senior citizens so people could live longer.
There is an actual discussion on a possible limit of 115 years for a human life span but there are a few folks who live past that. What ever the limit, if it exists, only a few can make it that long.
The above is an example of statistics being used in the media. Usually when I read something like this, I automatically begin researching the claims to see if the information is actually correct and explained in the proper context. We all know statistics can be misleading, so its good to check out the information.
We know what the stats are for Italy but what are the stats for the number of people who have reached 105 years old in the United States. There are several people in my family who have made it to their late 80's. I know of at least one person who made it to 97 before they died while another recently reached 94. I don't know of many others who have made it that old. I do know the odds are against his making it to 110.
For this type of article, I would provide copies of it to my students to read, write down questions they have on the material, think of what if's, before trying to apply the material to information they have from the census bureau. They might create a spreadsheet to calculate the number of folks who live to 110 in several different countries.
It is important to read and think about articles found in the media because too many times, we accept the information without question and its not always presented properly.
Let me know what you think, I'd love to hear. Have a great day.
Monday, July 2, 2018
The Mathematics of Apps
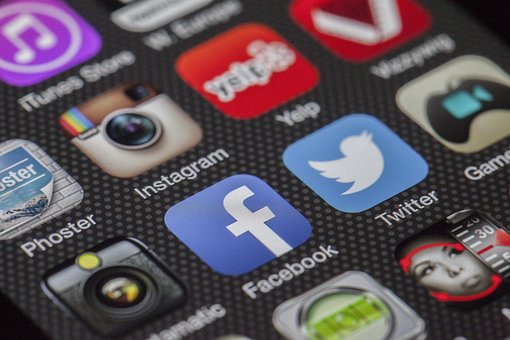 I've known for a while of one way to make money marketing apps but I recently learned of another way due to an article I read on Medium.
If you check out the internet, you'll find information on ways to make the app. The ways include create the concept and write the app yourself. If you can't code, create the concept and hire someone who will write the code for a flat fee. Either way, you market it via iTunes or Google Play to make money.
Another way is to buy the original code for an earlier game that did well and has been withdrawn from the store. When you buy the code, you agree to make changes so instead of a flying bird being the main object of the game, you make it a flying pizza, then market it.
The scenario of paying a developer and buying the code opens the door to calculating the break even point to determine at what point anyone starts making a profit. It is not too hard to find the percent that iTunes or Google store take for marketing the app.
In the scenario with the developer, there needs to be a bit of research done to determine the average cost of hiring a developer to write the code for a new game. That is part of the start up costs. For the other, the cost of purchasing the code is part of the start up cost. In either case, the cost of getting the code done is the constant in the equation. The next part is determining the percent the app receives from the app store is the coefficient of the variable in the linear equation.
In addition, you can have students create spreadsheets to change the selling price of the app to see what how the break even point changes for $0.99, $1.99, $2.99 costs. Students could also create surveys of other students to determine which price most people are willing to pay. They could also research the percent they get when selling the app at the iTunes store or Google play so they can use it in their spreadsheets.
A real life application of a basic linear equation for finding the break even point. Every so often, there are articles of people who have created apps that succeeded so well, they were able to quit their day jobs and focus only on app development. when students read that, they want to create their own apps to become rich but they have no idea how to determine break even points. The above two scenarios help students learn more about that.
The other way to get money from apps is to create a service which requires the user to subscribe to the service to use the app. The app is basically a portal to the service. I read an article which analyzed one of the best selling apps and discovered the author threw together a bunch of things in one place but made the money on the weekly charge. I think the weekly charge was $9.99 but over a year that is just under $520 per person.
The article opened my eyes to reading all descriptions carefully before getting an app which indicates a purchase associated with it. I've discovered many apps say the iTunes store will automatically charge so much per week against your credit card. This is where people make the money is not through the app itself but through the weekly charge.
It is possible to create a spreadsheet to determine the amount made by looking at the different amounts charged for a weekly amount. This activity opens up the opportunity for students to conduct research to determine the general weekly amount and the types of apps that do this.
Real world applications at their fingertips. Let me know what you think, I'd love to hear.
Sunday, July 1, 2018

Subscribe to:
Posts (Atom)