
Sunday, June 30, 2019
Saturday, June 29, 2019

Friday, June 28, 2019
Unit Rates.
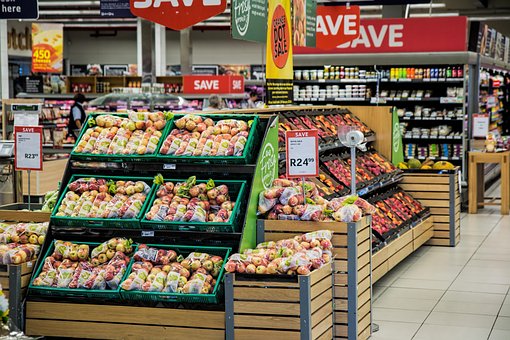 We all cover unit rates in the math classes we teach although most of the time the textbook loves to teach it in terms of price per ounce for some item such as pancake mix, juice, or laundry soap. Although it appears often in the grocery store, many people do not pay attention to this information so they do not see the cost per unit.
I spend time reading the little tags on the shelf when the store has them. Many small stores in Alaskan Villages do not have them so you can't use them to help shop.
One time, I was in town shopping for laundry soap. Not a hard thing except the unit breakdowns among the brands were not always the same. Some might have cost per ounce, while others had cost per box. I discovered that two smaller boxes cost less than the large box and you got more laundry soap with the two smaller boxes. If I hadn't checked, I might automatically have purchased the large one because the assumption is the large one is always more economical.
The grocery store is filled with more unit rates. Look at the produce when you buy it. So many items in the produce department are listed as a per unit cost such as apples are $2.49 per pound or plantains $0.99 each. These are unit costs. Check out cleaning supplies such as brooms or mops is a per unit cost.
If you look at most items such as material is a per yard or per meter cost, tires are per tire, and many tools are sold per item. Furthermore, if you look at nails and screws, they are sold per pound. Even cars are sold per item. Now admittedly, cars vary a bit according to the extras but usually the base price is the same.
I like the idea of giving a homework assignment for students to find different unit prices at various stores to show how there are unit rates all over the place, everywhere you go. Even gas is listed as a per gallon here in the United States.
Just a way to show students unit rates are all around us. Let me know what you think, I'd love to hear your thoughts. Have a great day.
Thursday, June 27, 2019
The United States - Population vs Area
 It is the season of wild fires and forest fires in the state of Alaska. The state chooses not to fight every fire because many break out in totally uninhabited area and it too hard to get in there. In the process of looking up some information, I came a cross an article in the Alaska Business Insider with some great information.
The article takes time to explain why some of the maps show Alaska to be bigger or smaller than it is in relation to the continental United States. According to this article, Alaska with its 663,300 acres is about 2.5 times as big as Texas, but the continental United States is actually 4.7 times as large as Alaska.
The article then goes on to compare the size of Alaska to Canada, Mexico, Greenland, and so many other countries. They pointed out that India is almost twice the size of Alaska, while Russia is ten times the size of Alaska. The article provides enough information for students to use in an infograph of relative sizes.
If you want to know how the area of Alaska compares with all other 49 states, this site has a ranking from 1 to 50 of all the states based on area. There is enough information to create a graphical representation as long as people realize that many states have under 1 percent of the area of the whole country.
If you rank the states based on population, Alaska is down toward the bottom but not at the bottom but if you choose to use population density instead, Alaska is the least dense state with one person per square mile. This information comes from this site.
Looking at how Alaska compares by area, population, or density opens up the door to discussing which should be used under what circumstance. It also opens up discussions on the best way to represent the information. I've seen much of this information visually displayed using state maps and coloring the state based on ranges but is this really the best way to do it?
This could also open up the discussion of why might you use a bar graph or pie chart. Often times, we tell students to display information using a specific format and type of graph but we never discuss why it should be done this way. This type of information is great for discussions on why certain information is better displayed this way or that way.
I looked at Alaska because its summer right now because there are many fires the state refuses to fight because they are in areas where no one is living and no one is in danger of being hurt. When you have a population density of one person per square mile, this puts it into a better context of explaining why the government chooses to do things this way.
It also explains why they might immediately put a wild fire out in California with a density of 255 per square mile. Let me know what you think, I'd love to hear. Have a great weekend.
Wednesday, June 26, 2019
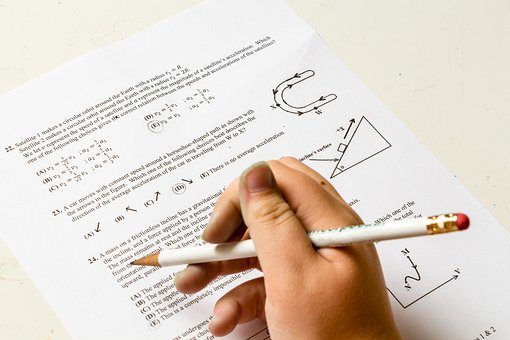
Check For Understanding
 The age old way of checking for understanding in the past required one simple question. "Do you understand?". The standard reply "Yes, of course I do" regardless of the actual level of understanding. Unfortunately, we cannot rely on this question to obtain a truthful response.
Thus we have to rely on other ways to gauge the actual level of student understanding. One quick way I use is to have students use either a white board or a drawing app on a digital device where they work out a simple problem and raise the board or device. above their heads. A quick look and I can see who has the problem done correctly or had trouble with it.
Here are some other quick ways to check for understanding. Most of these can be done either on paper or digitally.
1. Exit ticket - where students do a quick problem, create a written answer to a question, or provide the next step in the process. This does not need to take more than 5 minutes.
2. Quizzes - only need to be short and sweet. They need to be no more than 5 questions long and may include problems, explanations, or the next step.
3. Three color response with red, yellow, or green to show how confident the students are in doing the material. I've seen people use cards, cups, blocks, or even pipe cleaners. They place the color in front of them as they work so the teacher can just glance at the physical item to determine who needs help or who is doing well.
4. Reflection - ask students to reflect on what they learned in the lesson. This is where they include questions they still have or indicate what they still have trouble understanding or even why a certain step is done from step to another step.
5. Four corners - this activity uses multiple choice questions which might be as simple as four possible answers for an equation, to providing the answer and students choose the corner based on I agree, strongly agree, disagree, or strongly disagree. The only problem with this activity is that many students will go to the corner with the most people because they think that is the proper answer.
6. 3-2-1 for three things they learned, two things they need more information on and one question they have.
7. What is wrong with the problem - this is where you purposely work a problem incorrectly and students need to find the error and explain why it yields the wrong answer. I often choose. problem from the daily work to put up for analysis but I do not use the name.
8. Peer tutoring. Have students work with each other because if one can teach the other, they understand the material. If they can't it means they need a bit more work.
9. Choral reading - In math, choral reading takes the form of reading the same equation together such as the quadratic formula, or reading the text together. When students repeat the formula three times together, they are more likely to remember it.
10. Use a 1 to 4 rating system to allow students a chance to access their understanding of a topic. It just requires them to answer with one to four fingers so one is they really don't understand it and four is a they understand it so well, they could teach it. This tells the teacher their confidence level.
11. For vocabulary, have students come up with an example and non-example of the word. If the word is ratio, you might show the key on a map for an example or a pot of jam for a non-example.
12. Fill in your thoughts which is another vocabulary understanding exercise where the teacher creates a fill in the blank or blanks question or statement. such as an equation must have a ____________, other wise its an expression.
Just a few ways to incorporate checking for understanding in your classroom. These are quick, easy, and take very little time. Let me know what you think, I'd love to hear. Have a great day.
Tuesday, June 25, 2019
Visualizing Division of Fractions.

I have found it very difficult to draw a pictorial model that shows why you have to turn the problem of dividing one fraction by another fraction into a multiplication problem. If I struggle with it, you know our students will struggle with it since it seems counter intuitive.
If we take the problem 1/2 divided by 1/6 we get three as an answer but most students think that the 3 represents the whole number not the parts you get. So 1/2 divided by 1/6 gives us 3 but 3 what's.
The 1/6th means you divide the whole circle into 6 pieces just like the picture below. Then you look at 1/2 of the circle so there are three parts in that half. Thus the answer is 3.

Unfortunately, when students get a whole number as an answer, they automatically assume the answer is 3 as in the whole number rather than 3 parts make up half of the whole or 1/2 of the whole that is divided into 6 is 3 pieces.
It's a bit easier when you end up with a fractional answer but its still hard for them to understand the answer refers to parts the fraction is divided into. If you divide 1/2 by 1/5, you would follow the same process of dividing the whole into 5 equal pieces and taking half of that so you get 5/2 or 2 1/2 which is 2 1/2 pieces make up the 1/2.
I realize this approach is probably going to result in people disagreeing with me but its one of the few ways I can think of to get students that 2 1/2 is not two full circles and 1/2 of it, it is two full parts and 1/2 of a part.
This may be why people have difficulty in creating a visual representation of division so the picture meets the context of the of the equation of problem. If you have a better way of explaining it, I would love to hear your suggestions. Have a great day. In the mean time, I'm going to try to figure out how to use legos to explore this topic.
Monday, June 24, 2019
Reading Graphs Showing Beliefs.
 A friend sent me this link to an article in Popular Science on vaccines and various countries confidence in the use of them. I've seen these types of graphs before but I've never taken time to have students learn to read them.
The first three graphs show a map of the world with each country colored based on the percentage who believed in the topic.
One map explored which countries believe that vaccines are important, another explored the same countries belief vaccines are effective and the last the question of safety. Many countries scored low on all three graphs where the lowest percentage marked is 65 percent. The easiest graph to read is a Quadrant I grid based on the belief vaccines are important vs effective at the bottom
The y-axis runs from 60% to 100% on the question of important while the x-axis runs from 12.5% to 100 percent on the question of effectiveness. The key at the bottom shows a specific color for geographic location while the individual countries are shown on the graph itself with the color based on their region.
This graph gives students a chance to apply the coordinate system for each country. If the coordinate is (effectiveness, important), then Peru is (70, 94) while Japan is (61, 67). Finding the coordinate for each country should be fairly easy but when it comes to interpreting what these coordinates mean, many students will struggle because it is asking them to communicate meaning.
One way to interpret the data would be to say that in Peru they believe more in a vaccine's importance than its effectiveness while Japan doesn't have as strong a belief in it's importance or effectiveness. In addition, students can create a line of best fit for all the data and they can interpret the trends of geographic regions belief of importance vs effectiveness.
You might ask questions such as
1. Why might Ethiopia believe that vaccines are both important and effective while Belarus doesn't have a strong belief on vaccines?
2. Is there a trend in the regions whose beliefs range from vaccines are neither important or effective to are both important and effective?
3. Why might a country feel the vaccines are important but not effective?
4. Why might a country feel vaccines are not particularly important but effective.
Questions do not have to use numerical answers. They might ask students to interpret the data and communicate those ideas. Their conclusions may not be as neat and tidy as found in the textbook because this is real life data, not something developed to fit a specific topic in the book.
Let me know what you think, I'd love to hear. Have a great day.
Sunday, June 23, 2019

Saturday, June 22, 2019

Friday, June 21, 2019
Reading Statistics in Real Life

In the article, the author threw out statistics such as 3,000 to 5,000 people left Venezuela every day and that 3 million of the estimated 3.7 million people who have already escaped did so in the past five years.
Furthermore, the article indicates around 460,000 refugees have officially applied for asylum with several countries including Peru and the United States. The U.N. is working on providing nutritional help to about 190,000 children.
All statistics used in one newspaper article. If you stop to think about it, any article dealing with the economy, sports, or the stock market will have some great mathematical statistics. I realize not everyone has access to real newspapers but with access to the internet, it is easy to find things. I do not if students are aware of all the statistics contained in news.
Of course, the sports section has lots of statistics for a variety of sports. It shows students, even their favorite player has stats kept on them. This makes it more personal, and relatable. There is usually someone in class who can explain what each stat means and how it’s calculated. If you let this student explain, it becomes student lead, rather than teacher lead.
I plan to find articles containing all sorts of math for my students to read analyze, interpret and communicate the information in it. This is one aspect we as teachers do not spend enough time on. We do not teach our students to do this and they need it.
In addition, they need to learn to read ads with discounts, special financing, and manufacturers retail
prices. Applying the math to real situations rather than problems in the book will make the math more real to students because they can see its applications rather than experiencing it in an artificial situation.
So much math to share. Let me know what you think, I would love to hear. Have a great day.
Thursday, June 20, 2019
Rounding in Real Life

The one thing they all shared was a distaste for dealing with the smallest coins. I seldom saw anything smaller than the .10kn piece.
One of the ladies referred to the smallest coins, .05 and .01 kn, as fractional pieces. Many times rather than giving back exact change, they’d round the amount to something nice. I purchased two items at a grocery store for a total of $14.98kn. I gave the cashier a 20kn note and she gave me a 5kn coin in return.
As far as I can tell, this is standard practice for people who pay with cash. If they use a credit card, it makes no difference. I admit at the beginning before I got the hang of the money system, I didn’t realize what was happening but by the time I left, I understood the pattern.
I am not sure how it effects their bookkeeping but it seems everyone does it whether they are a farmer at the year round market or they work in the supermarket. On the other hand, most prices are set so they end with larger amounts and the total usually includes the taxes. I have only really had issues at stores ending in .99 at the grocery store, bedding store, or other places.
So now you’ve seen a real life example of rounding where it is done for convince. Let me know what you think, I would love to hear. We
Wednesday, June 19, 2019
Journaling Issues.

Over the years, I’ve tried incorporating journaling into my math classroom but it has not gone as well as I would like. Some of it has to do with the fact that too many of my students reach high school performing at a 3rd grade level. They have trouble articulating thoughts either in written or verbal form.
If I asked what they learned, they would copy things out of their notes or they’d write nothing. This is the same answer they gave when I asked if there was anything they didn’t understand. It took me a long time before I realized they didn’t know what to do.
These students went through elementary and middle school without being asked to journal do they didn’t know how or what to do. Most of the elementary teachers I know, just follow the bare requirements of the text book without asking students to explain their thinking. I do not believe these teachers learned how to have students express themselves in journals and most do not understand the concepts themselves.
What this means is that most of my students are behind developmentally in mathematics. They do not have the skill to express their thinking. Without this ability, it makes it harder, as teachers, to assess their understanding because they can’t explain concepts in their own word.
So I have to use writing prompts that are quite specific such as “I have to isolate the variable because” to give students a focal start. This gives them a starting point and over time it helps them learn to express themselves.
By the time students get to high school, they should communicate both verbally and in writing, create explanations, pose questions, and design arguments using appropriately correct mathematical language and symbols.
It is suggested one should ask open ended questions if you have to introduce journaling to students. The questions might ask how they feel about a topic, or their opinion on something in math. When they are more comfortable with journaling, ask them to explain how to do something they already know such as adding two decimals together. Besides choosing something they are familiar with, it also encourages them to review the material.
Then ask students about new material such as “how would you use decimals when you are shopping?” This allows them a chance to articulate their understanding. Always encourage students to use diagrams, drawings, to help communicate.
I’ve learned to teach students how to express their thinking because they don’t know how. Let me know what you think, I’d love to hear. Have a great day.
Tuesday, June 18, 2019
More on Geometric Proofs.
When I went through the teachers program, the focus was on starting at the beginning to the end but it was not necessary to have students fully understand why. In fact, I got through high school without writing a single proof so I never learned to do any until I started teaching.
In the past few years I’ve been looking for better ways to teach students how to write proofs. It needs to be done so students understand why you do things in a specific order. I tend to have students draw a flow chart to determine the order of steps in a proof before they actually begin the proof.
I also have students create two lists of theorems, postulates, etc. one list has the names of them while the other list has the same list with what it is used to prove or support. The first list is on the left hand page while the second list is on the right side. It is important to know what each theorem etc is used to prove in a proof.
Another thing is to work on having students fill in the given information before they do anything else. My students had so much trouble understanding they needed to start with the givens. I finally explained it as the givens are what ingredients you have to make a cake with. The prove is the type of cake and the in between is where you get the rest of the ingredients, mix them in the right order, and bake it.
One way to make the process a bit easier is to begin with a fully done proof and cut the lines of statement and reason into pieces, mix them up before having students reassemble them into the
correct order.The next step is to begin removing reasons so students fill the reasons, then take out some statements and reasons but not for the same step.
I like having students use colored pencils to highlight the parts of the diagram and then write the statement and reason in a matching color so students “see” what they’ve done. It is important to mark up the proof with arrow etc so students see how the steps relate to each other.
All of these things make it easier for students to understand the process of writing a successful geometric proof. Let me know what you think, I’d love to hear. Have a great day.
Monday, June 17, 2019
Are Geometry Proofs Still Needed?

My students wonder why they need to learn all those postulates, theorems, etc we normally teach in Geometry class. Why write proofs using them if they can “see” why, then do they need to “prove” it. I ask them if they can explain why two triangles are congruent using the given information. About 98 percent of the time, they can’t, so it proves they do need to learn it all.
I believe it is important because the theorems, etc, give us a much better grasp of geometry itself. I think half the problem is that many of us teach proofs the same way we learned them, in a very dry and straight forward manner. We start with the given and go to the end, using the appropriate theorem, etc with the appropriate reason. We do not spend enough time helping them understand all the connections.
If you look on the internet or in app stores there is nothing that is set up to automatically do geometry proofs so students have to search each problem individually to find a proof for it. In my search for this type of site, I discovered this site which has interactive proofs for a variety of problems.
By interactive, I mean it provides a problem with the given and prove part along with all the steps and reasons mixed up. You drag each step and reason into the correct location until all the spaces are filled. Once you are done, click the check button and it lets you know if your solution is correct. If it’s not, it simply says try again.

This makes it a great practice site because students do not have to figure out all the steps necessary. If a stun dent is incorrect the first time they try it, they can erase everything and start again. The site allows access to certain proofs so you can assign them or you can create your own. In addition, students can hit a button to bring up a random proof.
As a teacher, you can copy and paste a link to a random problem that focuses on a proof you want them to practice. If you do not find a proof you like, you have the ability to create your own interactive proof using the names of theorems you want. The great thing is that the site is free to signup for and use.
Tomorrow, I will share some great tips for teaching proofs so students end up with better notes and are easier to understand. let me know what you think, I would love to hear. Have a great day.
Sunday, June 16, 2019
Warmup
If a coconut tree produces 560 coconuts over a period of 8 years, how many coconuts were produced on average?
Saturday, June 15, 2019
Warmup
You and a friend are traveling from Zagreb, Croatia to Vienna, Austria. You can buy two tickets and fly or you can hire a driver and car to get you there, It takes about the same amount of time either way. Which way would you choose to get to Vienna? Explain your answer.
Friday, June 14, 2019
Room size

Thursday, June 13, 2019
Pre and Post Testing in Math
Over the years, I've slipped on giving pre-tests because so many of my students have been traveling that it was hard to do even the unit tests. Unfortunately, the school had a 52% absenteeism rate and it got easier just to go through the material.
Next year, I've made a promise to get back to using pre and post tests because both provide useable data. The pre-test helps identify student weaknesses so the lesson can focus on that rather than what they already know.
This data allows the teacher to develop a lesson which incorporates both differentiation and scaffolding to meet the needs the different levels of proficiency. Most times when we discuss proficiency, we classify students as below basic, basic, proficient, or advanced. If students score at least a proficient on a topic, it means the teacher does not have to teach that topic since the students know it and the teacher can move on.
The advantages of a pretest include:
1. The pre-test shows the level of student understanding and knowledge while the post test shows how much the student learned over the course of the unit. The information on how much students learned in a unit can be compared to other years or other classes
2. Pre-tests do not only provide teachers with data but they also give the students a preview of the material being covered in the unit. Furthermore, the pretest exposes the student to vocabulary, key ideas, and concepts and the more exposure students get, the more likely they will learn the material and this is just the first step for the unit.
3. Pre-tests can also help identify any gaps the students how so the teacher can incorporate scaffolding in the lesson. Some of the questions can be on the new topic but be done in such a way as to incorporate some review.
4. Pre-tests can also be used to determine the effectiveness of the curriculum. It can also be used to see if any of the changes made to the curriculum is effective based on test results.
One of the biggest disadvantages to using pre-tests is that they must be well written or they will not provide effective data.
As stated earlier post tests help the teacher determine the amount of growth a student made during the unit. In addition, the post test gives information on whether the material needs to be retaught or the students learned it well enough to move on. Post tests can also help teachers determine what students still do not understand.
Teachers then use the data from the post test to write future lesson plans because they need to be focused on helping students become proficient in mathematics because post tests are a great assessment for identifying student misunderstandings or misconceptions, for finding additional gaps in their knowledge.
Let me know what you think, I'd love to hear. Have a great day.
Wednesday, June 12, 2019

Tuesday, June 11, 2019
Frequent Quizzes
 If you've read any of the up-to-date information on helping students retain information, one of the items listed is for students to frequently take quizzes or quiz themselves. Most of my students look at me as if I've lost my mind when I suggest they quiz themselves at home over the material covered that day.
So it's easier for me to provide regular quizzes because I can use create a variety of quiz types. One of my favorite is Kahoot because there are lots of remade quizzes or its easy to make your own. You can have one that is 5 questions long or 35 depending on if you want something quick to check a few things or you are reviewing for a test.
The great thing is it can be played on almost any mobile device in a 1 to 1 situation or using shared devices. My students love it because they see it as a game and want to be one of the winners.
There is Flubaroo which is easy to install and use. This free application allows you to create the assignment, the answer key, assign it, grade it, and get the scores. Besides just grading, it also computes the average score for the assignment, computes the average score for each question, and provides a grade distribution graph. It also lets you email each student with their grade and the answer key or you can send individualized feedback.
Another one is Classmaker, a website where you can create quizzes. This site allows you to create multiple choice, short answers, true/false, matching, essays and so many more. It's only been recently, I realized it is possible to use matching quizzes to test out vocabulary by having students match the word with the definition. Sometimes we do not spend enough time focusing on vocabulary.
In addition, multiple choice can be used for students to select the correct answer for a problem or identify the next step in the process. Short answers are always good for questions that ask "Why?". This gives students a chance to communicate. The quizzes can be used on tablets, computers, and chrome. Furthermore, you can check the results from the quiz. The information includes percent, how long they spent on the quiz, and you can see which questions they got correct and which they missed. The best thing is that it is free for up to 100 quizzes a month, then you have to upgrade.
There are more possibilities for making quizzes out there that are free. I'll address this another day but these are three to get you started. Let me know what you think, I'd love to hear. Have a great day.
Monday, June 10, 2019
Learning Menus

The teacher sets it up but the students have the choice as to which ones they will do, the order of completion and they choose the time frame for each choice, all within the general assignment. Sometimes, there will be a section that must be done while there are choices for other sections or the menu may be set up so a student has to select assignments that add up to say 100 points for each section.
There are several types of menus ranging from one resembling a food menu with appetizers, entree's, sides, and desserts to others similar to agendas with imperatives, negotiable, and options to Think-Tac-Toe, a game show menu and more. Each one is set up to provide choices, differentiation, and empowerment.
So in general Choice Boards, regardless of form, provide work in a different format, provides choices so those who struggle will find problems they can do while more advanced students can also find problems they will enjoy. In addition, the assignments evoke interest while having students work on the same standards or learning goals and learning the same key concepts, and skills. In essence, the choice board is a learning contract between the teacher and student and provides an inbuilt assessment while focused on objectives.
Since there are a variety of choice boards, a teacher does not have to use the same one time, after time, to the point students get bored. Even within types, there is a difference. For instance, menu's can be found in several formats. One of the most common is one with everything in the main dish section being required. For appetizers, side dishes , the student is given a number of choices that must be done for each and dessert might be optional. Another way of doing it is to give students a choice of say 2 problems for each topic. It's all varied.
Think-tac-toe are done in a tic-tac-toe format usually in a 3 by 3 or 4 by 4 grid where students choose a certain number of activities so they complete a whole row across, up and down, or diagonally. Each choice requires a different type of activity such as creating a crossword puzzle for vocabulary, create a game, do a video to explain, or watch a video and write a summary.
Of course some other possibilities include a game show menu with say 5 topics and 5 choices for each topic with each choice being assigned a number of points. Award prizes such as homework passes or quiz passes for finishing that number of points. Other menu's might be a 20/50/80 where each group is worth so many points and that section will have a variety of activities. The idea is to complete 100 points worth of activities. The higher the points, the more difficult they are.
Now it is possible to find templets on the internet for physical menus but the problem with physical copies is that many students tend to loose them so you can always create digital versions of the menus. Kasey Bell of Shakeup Learning, has great instructions for creating digital learning menus using G-Suite if you'd prefer the digital version.
Let me know what you think, I'd love to hear. Have a great day.
Sunday, June 9, 2019
Warm-up

If this model is built using a 1:40 ratio and its 23 feet long, how long is the boat in real life?
Saturday, June 8, 2019
Warm-up

If this Lego Titanic is 23 feet long and the builders used 200,000 legos, about how many are used in each foot length of the boat?
Friday, June 7, 2019
Imathland

The description made it sound a bit better but you never know until you give it a try. The app just has the name when it opens up but if you hit the button on the top left side, you get a menu telling you what topics it covers. Some of the topics include trigonometry, polar coordinates and order of operations.

The menu has drop down arrows so you know there is more than just the topic. When you hit the arrow, you get the exact material covered in the section.
This makes it nicer because you know ahead of time what you will be looking at. Unfortunately, some topics have more of a general presentation such as trig and polar coordinates while others get much more detailed such as in order of operations and linear equations.

The section on graphing linear equations
The graphing linear equations covers all three forms. It has you select the form you want and then you must put choose values so the application can show you where the numbers are substituted into the formula.
 If you notice, I was asked to select a b and a m for the slope - intercept form. Once I select the value from the drop down menus, the program takes the values and shows me where they go into the y = mx + b using one color for the slope and another for the intercept.
It is great since it makes you a part of the teaching process rather than providing all the notes. Once the equation is shown, the program goes on to graph the equation using animation so you see the starting point and the line.
 This screen shot is out of polynomials. It shows how to combine like terms with an explanation of what is going on and what you need to do.
The next screen has you try it yourself. Again if your answer is correct, it turns green, if it isn't correct, it turns red so you get immediate feedback.
The only thing is that it doesn't tell you why you missed it only that you did get it wrong.

As you can see, I did one of the addition problems of 6x^3y^2 - 10x^3y^2. I got the answer correct. down below the problem it told me I needed to use the ^ to indicate it was a power.
Although this still has a few things I'd like to see, it is more interactive than many others I've seen and the best thing is that it is free.
If you've used it let me know what you think of it. I'd love to hear. Have a great day.
Thursday, June 6, 2019
Mixed Reality

One of the things I discovered were Augmented Reality Books where you download an app for the book. You then point the digital device at the page and something from the page pops up such as a bug, or a dog, or the solar system.
Along the way, I discovered something called Mixed Reality. Before discussing it, I'm going to review a couple of definitions. Virtual Reality or VR is where the person is immersed in a completely artificial world sort of like the Holodeck on Star Trek. If you ever see a 360 icon in the corner of say a video, the icon means you can use a headset to experience the virtual reality.
Augmented Reality or AR is where something artificial is placed in the real world to enhance it. Mixed Reality or MR, also known as hybrid reality, is where the viewer can react with both the real world and the virtual world together. The biggest difference between AR and MR is in MR, you can react with the virtual objects or you can start with a virtual world with the virtual overlapping the real world rather than ignoring it.
Mixed reality is considered the most interactive of the three. Many of you have played a game using mixed reality. I can see people frowning and thinking. If you've played Pokeman go, you've played a mixed reality game. Unfortunately, there is not much out there on using mixed reality in math.
Several people at MIT have been working on "Mathland" which is a mixed reality world where students interact with their environment to learn math more naturally. They created a mixed reality world filled with mathematical concepts for students to interact with as a way of learning mathematics. Initial results are encouraging but if you want to read more on the topic, check these articles out.
One interesting thing about mixed reality is that it is often referred to as virtual reality or augmented reality because the activity is set up so the student can experience being on the titanic as it sinks. I believe activities such as this are classified as mixed because the construct is completely artificial but it is based on reality and the students interact with their environment. Unfortunately, these types of experiences for math students are not as easy to find. The technology is here but the topic isn't.
If you know of any mixed reality math programs or experiences, please let me know, I'm always on the lookout for new ideas. I came away from the conference with a merge cube and a beautiful headset. Talk about exploring, I am going to have fun. Let me know what you think, I'd love to hear.
Tomorrow, I'll be reviewing a math app that is new to me. It is instructional but it includes an interactive component that makes it more engaging. Have a great day.
Wednesday, June 5, 2019
Plickers
 I am attending a technology conference in Honolulu right now. During one of the presentations on free tools and technologies to use in the classroom, Plickers came up. I've seen it before but I keep forgetting about it.
Plickers is a way to incorporate formative assessment into the class in a very interactive way.
The teacher downloads the accompanying app because the app is what the teacher uses to read the responses. They also download the cards for free from the company or they can buy a laminated set from Amazon. The card has a number on it and the letters A, B, C, and D for multiple choice, true/false or survey questions.
Once the teacher has both of these set up, they can set up one or more questions to check student understanding. The teacher shows the question, students hold up the card with the appropriate letter up and they then scan the cards in the room with the app. The app records all answers and sorting them into correct and incorrect so the teacher knows who got it right.
In addition, the program is set to produce reports giving the teacher information breaking down who got the question right or wrong and this information then appears in a spreadsheet with color coding so you can see how each student does over time. The color coding lets the teacher see at a glance how well they did in terms of percent of questions answered correctly.
I can see using this particular program in math either to check new vocabulary by giving choices of definitions or even what its not. It could be used to check their understanding on the process in the form of showing part of a problem and asking "What is the next step?" either by having the actual line or having the answer in verbal form.
It is possible to use true or false questions as the second step of the problem is correct, true or false. Another way of using true or false is if the last line is the proper next step. So many possibilities.
There is a wonderful checklist that appears when you first check in to lead you through the process of setting everything out. Have a great day and let me know what you think. I'd love to hear.
Tuesday, June 4, 2019
Mathematical Modeling and Surf Boards
 Surf boards have so many variations depending on what you want and what type of surfer you are but how much of the design is based on scientific or mathematical research?
A lot of the adjustments and choices are based on how well various surfers do. The idea is that if it worked for them, it should work for everyone.
Considering over 2.5 million surfers in the United States in 2016 which was up 40 percent from 2004, interest in the scientific community has also increased.
In 2017, Cranfield University in the United Kingdom published a report in the Journal of Sports Engineering and Technology explains the results of their mathematical modeling of fins on a surfboard. The fin is the small curved piece sticking off the bottom, and a surfboard may have one, three or four on the bottom.
They explored the idea that fluid dynamics could be modeled to model the peak performing fin because the fin is what helps surfers maneuver through the water while accelerating. The fin causes it to go faster and to grip the wave giving them more control, or in other words it is a type of lift. Surfers want fins that emphasize lift while eliminating as much drag or slowing as possible.
The people who carried out the study decided the fin operates in water the same way the airplane wing works in air so they can use aerodynamic mathematical modeling to try to find the precise shaped fin that produces the most lift with minimal drag. Beginning with the standard shape, they calculated lift to drag ratios before making adjustments to shape, thickness, depth, length, base shape, and curve until they created a fin with a 14.32 lift to drag ratio. This was a 62 percent increase over the original.
It took them 42 different iterations before they arrived at the final ratio. In the overall scheme of things, the changes may not make much difference to the average surfer, this could make a huge difference to the professional for whom the smallest change can make a difference. This is cool to know they can use fluid dynamics and aeronautics to lean more about the "perfect" fin.
Another man, Bowen, due to the frustration of having to buy a board every 6 months or so because the boards would split, did some research and revamped the basic surfboard which lead to him starting his own surfboard company. The normal technique is to place a piece of balsam wood in a piece of polyurethane foam. This blank is then shaped into the proper surfboard shape before being finished. Bowen revamped the traditional way of making surfboards by making his with layers because the layers give more flexibility making them more dynamic and less likely to break.
Let me know what you think, I'd love to hear. Have a great day.
Monday, June 3, 2019
Surf Boards and Math

This past weekend, I took a few minutes to speak with Adam of T & S Surf Designs, organizer of the surfing contest for ages 6 to 12, held this past weekend at Prince Kuhio beach in Waikiki. He was quite willing to take time to discuss the mathematics used in the design of surfboards and how the surfers were judged at the contest.
Most surfboards come in standard sizes of height, width, depth and volume because sometimes a surfer wants a shorter board with the same volume so the maker can make the appropriate adjustments. The height is from top to bottom or tip to tail in proper language. The sides are also known as the rail and the rocker or curve from top to tail.
Then as I was walking back from another trip out and stopped through Koa Board Sports where a very helpful gentleman explained the parts of a board in more detail. He showed me the two basic types of tips, the rounded and the pointed one.
He also explained about single fins, triple and quad fins, their uses and why you might want three instead of one. He also showed me boards with concave or convex places and some even have two concave spots. He took time to show me the different types of curves you can find in a surfboard from tip to tail.
In addition, the longer the board, the less maneuverable it is and the thicker it is, the more resistance, buoyancy, and volume you have. There is a lot of math involved in planning the curves, the amount of curve, placement of the different curves, length, width, depth, type of tail, type of tip, all based on the type of surfing you do and your experience level.
For the contest, there are three judges who watch each competitor perform three runs. They look for the length of the ride, the difficulty of the ride or how many different things did they do. Some one who rides straight in will get fewer points than someone who zigs across the wave and back.
Out of the three rides, the lowest scoring one is thrown out while the other two rides are averaged to get a final score. It is on these scores competitors place in the competition and determine the winners. So they use an averaging system.
Tomorrow, I'll address mathematical modeling and surfboards in a bit more detail. Let me know what you think, I'd love to hear. Have a great day.
Sunday, June 2, 2019

Saturday, June 1, 2019

Subscribe to:
Posts (Atom)