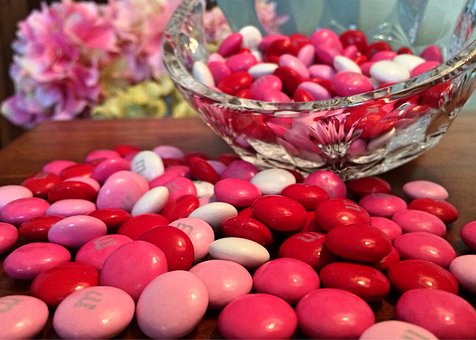
 In the past, I've used M&M's or Skittles to teach students about pie charts. They've sorted the candy into each color before calculating the percent of each color in the package. Once they had the information in fraction, decimal, and percent forms, they were ready to create pie charts, bar graphs and other methods of visualizing the information.
I am about 2 years behind in reading my NCTM magazines. In the September 2016 issue of Mathematics teacher, a title involving tootsie pops and statistics caught my attention.
A quick search shows a variety of candy based activities designed to teach both probability or statistics. The candy element creates interest especially if they know they will be able to eat the sweets when the lesson is completed. I will share a few of the resources and links so you can explore the activities in more detail.
The Society For The Teaching of Psychology has a wonderful pdf filled with 9 activities and demonstrations designed to teach basic statistics and research methods. These activities cover everything from population and samples to components of experiments, to central tendencies and probability. Only one of the actual activities uses candies, number eight, but the others use music, dating, football, etc.
The eighth activity uses skittles to help teach more about population, sampling, probabilities and includes vocabulary. There are 5 questions asking them to calculate the probability for finding skittles that are not red, selecting three oranges from the bag and other situations.
How about having two bags of small bars of candy. In the first bag you tell students there is a equal mix of Mars, Twix, and Snickers. You tell students that if they can guess the candy you just drew out they get it. What they don't know is that you placed only Mars bars in the bag. After about 6 bars, see if the students have noticed things are not quite right. This leads to a wonderful discussion of the probability of getting three in a row of the same candy if it has equal amounts of the three candy bars.
Then have them guess the candy you'll be pulling out of the second bag. This bag is filled with an equal mix of Twix and Snickers with no Mars bars. By now students are suspicious. This activity gives you a chance to discuss null hypothesis, hypothesis testing, and inference. The above activity came from the Learn and Teach Statistics blog.
From another Teach Psychology website, we have access to a power point presentation containing all the information to run the activity on Samples Representing The Population using M & M's. This activity begins by having all the students take their bag of M & M's, sort them by color, and calculate the percentage each color represented in the bag.
The students go around visiting with other students to write down their results and using all 6 samples to calculate the percent of each color over the larger sample. Students are asked to compare the results of the small samples with the larger population and then explain if the percentages changed. At the end, they compare their results with the official M & M percentages. The point of this exercise is to show students the larger the population, the more accurate the results.
I'll cover the Tootsie Pop exercise next week. Let me know what you think of these.
Have a great weekend.
No comments:
Post a Comment